Immigrants from Laos vs Immigrants from Western Asia In Labor Force | Age 16-19

COMPARE

Immigrants from Laos
Race
Ancestry
AfghanAfricanAlaska NativeAlaskan AthabascanAlbanianAleutAlsatianAmericanApacheArabArapahoArgentineanArmenianAssyrian/Chaldean/SyriacAustralianAustrianBahamianBangladeshiBarbadianBasqueBelgianBelizeanBermudanBhutaneseBlackfeetBolivianBrazilianBritishBritish West IndianBulgarianBurmeseCajunCambodianCanadianCape VerdeanCarpatho RusynCelticCentral AmericanCentral American IndianCherokeeCheyenneChickasawChileanChineseChippewaChoctawColombianColvilleComancheCosta RicanCreeCreekCroatianCrowCubanCypriotCzechCzechoslovakianDanishDelawareDominicanDutchDutch West IndianEastern EuropeanEcuadorianEgyptianEnglishEstonianEthiopianEuropeanFijianFilipinoFinnishFrenchFrench American IndianFrench CanadianGermanGerman RussianGhanaianGreekGuamanian/ChamorroGuatemalanGuyaneseHaitianHmongHonduranHopiHoumaHungarianIcelanderIndian (Asian)IndonesianInupiatIranianIraqiIrishIroquoisIsraeliItalianJamaicanJapaneseJordanianKenyanKiowaKoreanLaotianLatvianLebaneseLiberianLithuanianLumbeeLuxembourgerMacedonianMalaysianMalteseMarshalleseMenomineeMexicanMexican American IndianMongolianMoroccanNative HawaiianNavajoNepaleseNew ZealanderNicaraguanNigerianNorthern EuropeanNorwegianOkinawanOsageOttawaPaiutePakistaniPalestinianPanamanianParaguayanPennsylvania GermanPeruvianPimaPolishPortuguesePotawatomiPuebloPuerto RicanPuget Sound SalishRomanianRussianSalvadoranSamoanScandinavianScotch-IrishScottishSeminoleSenegaleseSerbianShoshoneSierra LeoneanSiouxSlavicSlovakSloveneSomaliSouth AfricanSouth AmericanSouth American IndianSoviet UnionSpaniardSpanishSpanish AmericanSpanish American IndianSri LankanSubsaharan AfricanSudaneseSwedishSwissSyrianTaiwaneseThaiTlingit-HaidaTohono O'OdhamTonganTrinidadian and TobagonianTsimshianTurkishU.S. Virgin IslanderUgandanUkrainianUruguayanUteVenezuelanVietnameseWelshWest IndianYakamaYaquiYugoslavianYumanYup'ikZimbabwean
Immigration
NonimmigrantsImmigrantsAfghanistanAfricaAlbaniaArgentinaArmeniaAsiaAustraliaAustriaBahamasBangladeshBarbadosBelarusBelgiumBelizeBoliviaBosnia and HerzegovinaBrazilBulgariaBurma/MyanmarCabo VerdeCambodiaCameroonCanadaCaribbeanCentral AmericaChileChinaColombiaCongoCosta RicaCroatiaCubaCzechoslovakiaDenmarkDominicaDominican RepublicEastern AfricaEastern AsiaEastern EuropeEcuadorEgyptEl SalvadorEnglandEritreaEthiopiaEuropeFijiFranceGermanyGhanaGreeceGrenadaGuatemalaGuyanaHaitiHondurasHong KongHungaryIndiaIndonesiaIranIraqIrelandIsraelItalyJamaicaJapanJordanKazakhstanKenyaKoreaKuwaitLaosLatin AmericaLatviaLebanonLiberiaLithuaniaMalaysiaMexicoMicronesiaMiddle AfricaMoldovaMoroccoNepalNetherlandsNicaraguaNigeriaNorth AmericaNorth MacedoniaNorthern AfricaNorthern EuropeNorwayOceaniaPakistanPanamaPeruPhilippinesPolandPortugalRomaniaRussiaSaudi ArabiaScotlandSenegalSerbiaSierra LeoneSingaporeSomaliaSouth AfricaSouth AmericaSouth Central AsiaSouth Eastern AsiaSouthern EuropeSpainSri LankaSt. Vincent and the GrenadinesSudanSwedenSwitzerlandSyriaTaiwanThailandTrinidad and TobagoTurkeyUgandaUkraineUruguayUzbekistanVenezuelaVietnamWest IndiesWestern AfricaWestern EuropeYemenZaireZimbabweAzores
Immigrants from Western Asia
Race
Ancestry
AfghanAfricanAlaska NativeAlaskan AthabascanAlbanianAleutAlsatianAmericanApacheArabArapahoArgentineanArmenianAssyrian/Chaldean/SyriacAustralianAustrianBahamianBangladeshiBarbadianBasqueBelgianBelizeanBermudanBhutaneseBlackfeetBolivianBrazilianBritishBritish West IndianBulgarianBurmeseCajunCambodianCanadianCape VerdeanCarpatho RusynCelticCentral AmericanCentral American IndianCherokeeCheyenneChickasawChileanChineseChippewaChoctawColombianColvilleComancheCosta RicanCreeCreekCroatianCrowCubanCypriotCzechCzechoslovakianDanishDelawareDominicanDutchDutch West IndianEastern EuropeanEcuadorianEgyptianEnglishEstonianEthiopianEuropeanFijianFilipinoFinnishFrenchFrench American IndianFrench CanadianGermanGerman RussianGhanaianGreekGuamanian/ChamorroGuatemalanGuyaneseHaitianHmongHonduranHopiHoumaHungarianIcelanderIndian (Asian)IndonesianInupiatIranianIraqiIrishIroquoisIsraeliItalianJamaicanJapaneseJordanianKenyanKiowaKoreanLaotianLatvianLebaneseLiberianLithuanianLumbeeLuxembourgerMacedonianMalaysianMalteseMarshalleseMenomineeMexicanMexican American IndianMongolianMoroccanNative HawaiianNavajoNepaleseNew ZealanderNicaraguanNigerianNorthern EuropeanNorwegianOkinawanOsageOttawaPaiutePakistaniPalestinianPanamanianParaguayanPennsylvania GermanPeruvianPimaPolishPortuguesePotawatomiPuebloPuerto RicanPuget Sound SalishRomanianRussianSalvadoranSamoanScandinavianScotch-IrishScottishSeminoleSenegaleseSerbianShoshoneSierra LeoneanSiouxSlavicSlovakSloveneSomaliSouth AfricanSouth AmericanSouth American IndianSoviet UnionSpaniardSpanishSpanish AmericanSpanish American IndianSri LankanSubsaharan AfricanSudaneseSwedishSwissSyrianTaiwaneseThaiTlingit-HaidaTohono O'OdhamTonganTrinidadian and TobagonianTsimshianTurkishU.S. Virgin IslanderUgandanUkrainianUruguayanUteVenezuelanVietnameseWelshWest IndianYakamaYaquiYugoslavianYumanYup'ikZimbabwean
Immigration
NonimmigrantsImmigrantsAfghanistanAfricaAlbaniaArgentinaArmeniaAsiaAustraliaAustriaBahamasBangladeshBarbadosBelarusBelgiumBelizeBoliviaBosnia and HerzegovinaBrazilBulgariaBurma/MyanmarCabo VerdeCambodiaCameroonCanadaCaribbeanCentral AmericaChileChinaColombiaCongoCosta RicaCroatiaCubaCzechoslovakiaDenmarkDominicaDominican RepublicEastern AfricaEastern AsiaEastern EuropeEcuadorEgyptEl SalvadorEnglandEritreaEthiopiaEuropeFijiFranceGermanyGhanaGreeceGrenadaGuatemalaGuyanaHaitiHondurasHong KongHungaryIndiaIndonesiaIranIraqIrelandIsraelItalyJamaicaJapanJordanKazakhstanKenyaKoreaKuwaitLatin AmericaLatviaLebanonLiberiaLithuaniaMalaysiaMexicoMicronesiaMiddle AfricaMoldovaMoroccoNepalNetherlandsNicaraguaNigeriaNorth AmericaNorth MacedoniaNorthern AfricaNorthern EuropeNorwayOceaniaPakistanPanamaPeruPhilippinesPolandPortugalRomaniaRussiaSaudi ArabiaScotlandSenegalSerbiaSierra LeoneSingaporeSomaliaSouth AfricaSouth AmericaSouth Central AsiaSouth Eastern AsiaSouthern EuropeSpainSri LankaSt. Vincent and the GrenadinesSudanSwedenSwitzerlandSyriaTaiwanThailandTrinidad and TobagoTurkeyUgandaUkraineUruguayUzbekistanVenezuelaVietnamWest IndiesWestern AfricaWestern AsiaWestern EuropeYemenZaireZimbabweAzores
In Labor Force | Age 16-19
Income
Poverty
Unemployment
Labor Participation
Family Structure
Vehicle Availability
Education Level
Disability

In Labor Force | Age 16-19 Comparison

Immigrants from Laos

Immigrants from Western Asia

Exceptional
Tragic
40.6%
IN LABOR FORCE | AGE 16-19
100.0/ 100
METRIC RATING
52nd/ 347
METRIC RANK
34.8%
IN LABOR FORCE | AGE 16-19
2.0/ 100
METRIC RATING
251st/ 347
METRIC RANK

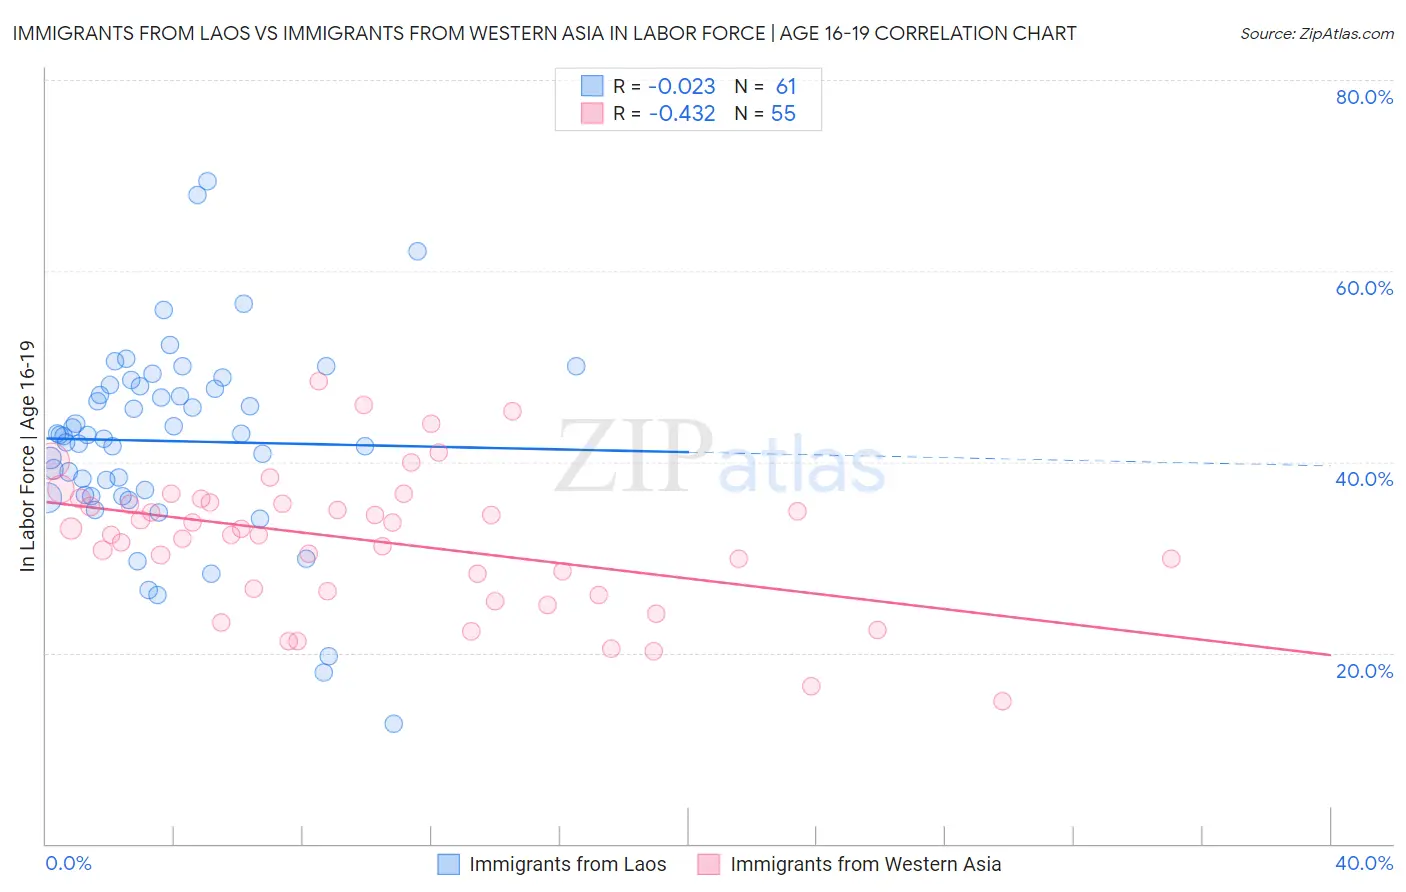
Immigrants from Laos vs Immigrants from Western Asia In Labor Force | Age 16-19 Correlation Chart

The statistical analysis conducted on geographies consisting of 201,366,524 people shows no correlation between the proportion of Immigrants from Laos and labor force participation rate among population between the ages 16 and 19 in the United States with a correlation coefficient (R) of -0.023 and weighted average of 40.6%. Similarly, the statistical analysis conducted on geographies consisting of 403,680,929 people shows a moderate negative correlation between the proportion of Immigrants from Western Asia and labor force participation rate among population between the ages 16 and 19 in the United States with a correlation coefficient (R) of -0.432 and weighted average of 34.8%, a difference of 16.8%.
Immigrants from Laos vs Immigrants from Western Asia In Labor Force | Age 16-19

In Labor Force | Age 16-19 Correlation Summary

MeasurementImmigrants from LaosImmigrants from Western Asia
Minimum12.6%14.9%
Maximum69.4%48.4%
Range56.8%33.5%
Mean42.2%31.7%
Median42.8%32.4%
Interquartile 25% (IQ1)36.5%26.4%
Interquartile 75% (IQ3)48.0%35.7%
Interquartile Range (IQR)11.5%9.3%
Standard Deviation (Sample)10.3%7.2%
Standard Deviation (Population)10.3%7.2%

Similar Demographics by In Labor Force | Age 16-19

Demographics Similar to Immigrants from Laos by In Labor Force | Age 16-19

In terms of in labor force | age 16-19, the demographic groups most similar to Immigrants from Laos are Immigrants from Zaire (40.7%, a difference of 0.090%), Indonesian (40.7%, a difference of 0.19%), Immigrants from Kenya (40.5%, a difference of 0.32%), Cree (40.8%, a difference of 0.34%), and Tlingit-Haida (40.5%, a difference of 0.35%).
DemographicsRating | RankIn Labor Force | Age 16-19
Croatians
100.0
/100
|
#45
Exceptional
41.1%
Immigrants | Sudan
100.0
/100
|
#46
Exceptional
41.0%
Carpatho Rusyns
100.0
/100
|
#47
Exceptional
40.8%
Icelanders
100.0
/100
|
#48
Exceptional
40.8%
Cree
100.0
/100
|
#49
Exceptional
40.8%
Indonesians
100.0
/100
|
#50
Exceptional
40.7%
Immigrants | Zaire
100.0
/100
|
#51
Exceptional
40.7%
Immigrants | Laos
100.0
/100
|
#52
Exceptional
40.6%
Immigrants | Kenya
100.0
/100
|
#53
Exceptional
40.5%
Tlingit-Haida
100.0
/100
|
#54
Exceptional
40.5%
British
100.0
/100
|
#55
Exceptional
40.5%
Fijians
100.0
/100
|
#56
Exceptional
40.4%
Lithuanians
100.0
/100
|
#57
Exceptional
40.4%
Aleuts
100.0
/100
|
#58
Exceptional
40.4%
Slavs
100.0
/100
|
#59
Exceptional
40.4%

Demographics Similar to Immigrants from Western Asia by In Labor Force | Age 16-19

In terms of in labor force | age 16-19, the demographic groups most similar to Immigrants from Western Asia are Immigrants from Chile (34.8%, a difference of 0.010%), Immigrants from Pakistan (34.8%, a difference of 0.020%), Immigrants from Ukraine (34.8%, a difference of 0.12%), Central American (34.8%, a difference of 0.15%), and Laotian (34.9%, a difference of 0.23%).
DemographicsRating | RankIn Labor Force | Age 16-19
Immigrants | Turkey
2.6
/100
|
#244
Tragic
34.9%
Immigrants | Greece
2.4
/100
|
#245
Tragic
34.9%
Immigrants | Sri Lanka
2.4
/100
|
#246
Tragic
34.9%
Laotians
2.4
/100
|
#247
Tragic
34.9%
Central Americans
2.2
/100
|
#248
Tragic
34.8%
Immigrants | Ukraine
2.2
/100
|
#249
Tragic
34.8%
Immigrants | Pakistan
2.0
/100
|
#250
Tragic
34.8%
Immigrants | Western Asia
2.0
/100
|
#251
Tragic
34.8%
Immigrants | Chile
2.0
/100
|
#252
Tragic
34.8%
Immigrants | Japan
1.5
/100
|
#253
Tragic
34.7%
Bahamians
1.4
/100
|
#254
Tragic
34.6%
Peruvians
1.4
/100
|
#255
Tragic
34.6%
Immigrants | South Central Asia
1.3
/100
|
#256
Tragic
34.6%
Immigrants | Egypt
1.2
/100
|
#257
Tragic
34.6%
Thais
1.2
/100
|
#258
Tragic
34.6%