Immigrants from Kazakhstan vs Swiss In Labor Force | Age 45-54

COMPARE

Immigrants from Kazakhstan
Race
Ancestry
AfghanAfricanAlaska NativeAlaskan AthabascanAlbanianAleutAlsatianAmericanApacheArabArapahoArgentineanArmenianAssyrian/Chaldean/SyriacAustralianAustrianBahamianBangladeshiBarbadianBasqueBelgianBelizeanBermudanBhutaneseBlackfeetBolivianBrazilianBritishBritish West IndianBulgarianBurmeseCajunCambodianCanadianCape VerdeanCarpatho RusynCelticCentral AmericanCentral American IndianCherokeeCheyenneChickasawChileanChineseChippewaChoctawColombianColvilleComancheCosta RicanCreeCreekCroatianCrowCubanCypriotCzechCzechoslovakianDanishDelawareDominicanDutchDutch West IndianEastern EuropeanEcuadorianEgyptianEnglishEstonianEthiopianEuropeanFijianFilipinoFinnishFrenchFrench American IndianFrench CanadianGermanGerman RussianGhanaianGreekGuamanian/ChamorroGuatemalanGuyaneseHaitianHmongHonduranHopiHoumaHungarianIcelanderIndian (Asian)IndonesianInupiatIranianIraqiIrishIroquoisIsraeliItalianJamaicanJapaneseJordanianKenyanKiowaKoreanLaotianLatvianLebaneseLiberianLithuanianLumbeeLuxembourgerMacedonianMalaysianMalteseMarshalleseMenomineeMexicanMexican American IndianMongolianMoroccanNative HawaiianNavajoNepaleseNew ZealanderNicaraguanNigerianNorthern EuropeanNorwegianOkinawanOsageOttawaPaiutePakistaniPalestinianPanamanianParaguayanPennsylvania GermanPeruvianPimaPolishPortuguesePotawatomiPuebloPuerto RicanPuget Sound SalishRomanianRussianSalvadoranSamoanScandinavianScotch-IrishScottishSeminoleSenegaleseSerbianShoshoneSierra LeoneanSiouxSlavicSlovakSloveneSomaliSouth AfricanSouth AmericanSouth American IndianSoviet UnionSpaniardSpanishSpanish AmericanSpanish American IndianSri LankanSubsaharan AfricanSudaneseSwedishSyrianTaiwaneseThaiTlingit-HaidaTohono O'OdhamTonganTrinidadian and TobagonianTsimshianTurkishU.S. Virgin IslanderUgandanUkrainianUruguayanUteVenezuelanVietnameseWelshWest IndianYakamaYaquiYugoslavianYumanYup'ikZimbabwean
Immigration
NonimmigrantsImmigrantsAfghanistanAfricaAlbaniaArgentinaArmeniaAsiaAustraliaAustriaBahamasBangladeshBarbadosBelarusBelgiumBelizeBoliviaBosnia and HerzegovinaBrazilBulgariaBurma/MyanmarCabo VerdeCambodiaCameroonCanadaCaribbeanCentral AmericaChileChinaColombiaCongoCosta RicaCroatiaCubaCzechoslovakiaDenmarkDominicaDominican RepublicEastern AfricaEastern AsiaEastern EuropeEcuadorEgyptEl SalvadorEnglandEritreaEthiopiaEuropeFijiFranceGermanyGhanaGreeceGrenadaGuatemalaGuyanaHaitiHondurasHong KongHungaryIndiaIndonesiaIranIraqIrelandIsraelItalyJamaicaJapanJordanKazakhstanKenyaKoreaKuwaitLaosLatin AmericaLatviaLebanonLiberiaLithuaniaMalaysiaMexicoMicronesiaMiddle AfricaMoldovaMoroccoNepalNetherlandsNicaraguaNigeriaNorth AmericaNorth MacedoniaNorthern AfricaNorthern EuropeNorwayOceaniaPakistanPanamaPeruPhilippinesPolandPortugalRomaniaRussiaSaudi ArabiaScotlandSenegalSerbiaSierra LeoneSingaporeSomaliaSouth AfricaSouth AmericaSouth Central AsiaSouth Eastern AsiaSouthern EuropeSpainSri LankaSt. Vincent and the GrenadinesSudanSwedenSwitzerlandSyriaTaiwanThailandTrinidad and TobagoTurkeyUgandaUkraineUruguayUzbekistanVenezuelaVietnamWest IndiesWestern AfricaWestern AsiaWestern EuropeYemenZaireZimbabweAzores
Swiss
Race
Ancestry
AfghanAfricanAlaska NativeAlaskan AthabascanAlbanianAleutAlsatianAmericanApacheArabArapahoArgentineanArmenianAssyrian/Chaldean/SyriacAustralianAustrianBahamianBangladeshiBarbadianBasqueBelgianBelizeanBermudanBhutaneseBlackfeetBolivianBrazilianBritishBritish West IndianBulgarianBurmeseCajunCambodianCanadianCape VerdeanCarpatho RusynCelticCentral AmericanCentral American IndianCherokeeCheyenneChickasawChileanChineseChippewaChoctawColombianColvilleComancheCosta RicanCreeCreekCroatianCrowCubanCypriotCzechCzechoslovakianDanishDelawareDominicanDutchDutch West IndianEastern EuropeanEcuadorianEgyptianEnglishEstonianEthiopianEuropeanFijianFilipinoFinnishFrenchFrench American IndianFrench CanadianGermanGerman RussianGhanaianGreekGuamanian/ChamorroGuatemalanGuyaneseHaitianHmongHonduranHopiHoumaHungarianIcelanderIndian (Asian)IndonesianInupiatIranianIraqiIrishIroquoisIsraeliItalianJamaicanJapaneseJordanianKenyanKiowaKoreanLaotianLatvianLebaneseLiberianLithuanianLumbeeLuxembourgerMacedonianMalaysianMalteseMarshalleseMenomineeMexicanMexican American IndianMongolianMoroccanNative HawaiianNavajoNepaleseNew ZealanderNicaraguanNigerianNorthern EuropeanNorwegianOkinawanOsageOttawaPaiutePakistaniPalestinianPanamanianParaguayanPennsylvania GermanPeruvianPimaPolishPortuguesePotawatomiPuebloPuerto RicanPuget Sound SalishRomanianRussianSalvadoranSamoanScandinavianScotch-IrishScottishSeminoleSenegaleseSerbianShoshoneSierra LeoneanSiouxSlavicSlovakSloveneSomaliSouth AfricanSouth AmericanSouth American IndianSoviet UnionSpaniardSpanishSpanish AmericanSpanish American IndianSri LankanSubsaharan AfricanSudaneseSwedishSwissSyrianTaiwaneseThaiTlingit-HaidaTohono O'OdhamTonganTrinidadian and TobagonianTsimshianTurkishU.S. Virgin IslanderUgandanUkrainianUruguayanUteVenezuelanVietnameseWelshWest IndianYakamaYaquiYugoslavianYumanYup'ikZimbabwean
Immigration
NonimmigrantsImmigrantsAfghanistanAfricaAlbaniaArgentinaArmeniaAsiaAustraliaAustriaBahamasBangladeshBarbadosBelarusBelgiumBelizeBoliviaBosnia and HerzegovinaBrazilBulgariaBurma/MyanmarCabo VerdeCambodiaCameroonCanadaCaribbeanCentral AmericaChileChinaColombiaCongoCosta RicaCroatiaCubaCzechoslovakiaDenmarkDominicaDominican RepublicEastern AfricaEastern AsiaEastern EuropeEcuadorEgyptEl SalvadorEnglandEritreaEthiopiaEuropeFijiFranceGermanyGhanaGreeceGrenadaGuatemalaGuyanaHaitiHondurasHong KongHungaryIndiaIndonesiaIranIraqIrelandIsraelItalyJamaicaJapanJordanKenyaKoreaKuwaitLaosLatin AmericaLatviaLebanonLiberiaLithuaniaMalaysiaMexicoMicronesiaMiddle AfricaMoldovaMoroccoNepalNetherlandsNicaraguaNigeriaNorth AmericaNorth MacedoniaNorthern AfricaNorthern EuropeNorwayOceaniaPakistanPanamaPeruPhilippinesPolandPortugalRomaniaRussiaSaudi ArabiaScotlandSenegalSerbiaSierra LeoneSingaporeSomaliaSouth AfricaSouth AmericaSouth Central AsiaSouth Eastern AsiaSouthern EuropeSpainSri LankaSt. Vincent and the GrenadinesSudanSwedenSwitzerlandSyriaTaiwanThailandTrinidad and TobagoTurkeyUgandaUkraineUruguayUzbekistanVenezuelaVietnamWest IndiesWestern AfricaWestern AsiaWestern EuropeYemenZaireZimbabweAzores
In Labor Force | Age 45-54
Income
Poverty
Unemployment
Labor Participation
Family Structure
Vehicle Availability
Education Level
Disability

In Labor Force | Age 45-54 Comparison

Immigrants from Kazakhstan

Swiss

Excellent
Average
83.0%
IN LABOR FORCE | AGE 45-54
81.0/ 100
METRIC RATING
136th/ 347
METRIC RANK
82.8%
IN LABOR FORCE | AGE 45-54
56.5/ 100
METRIC RATING
167th/ 347
METRIC RANK

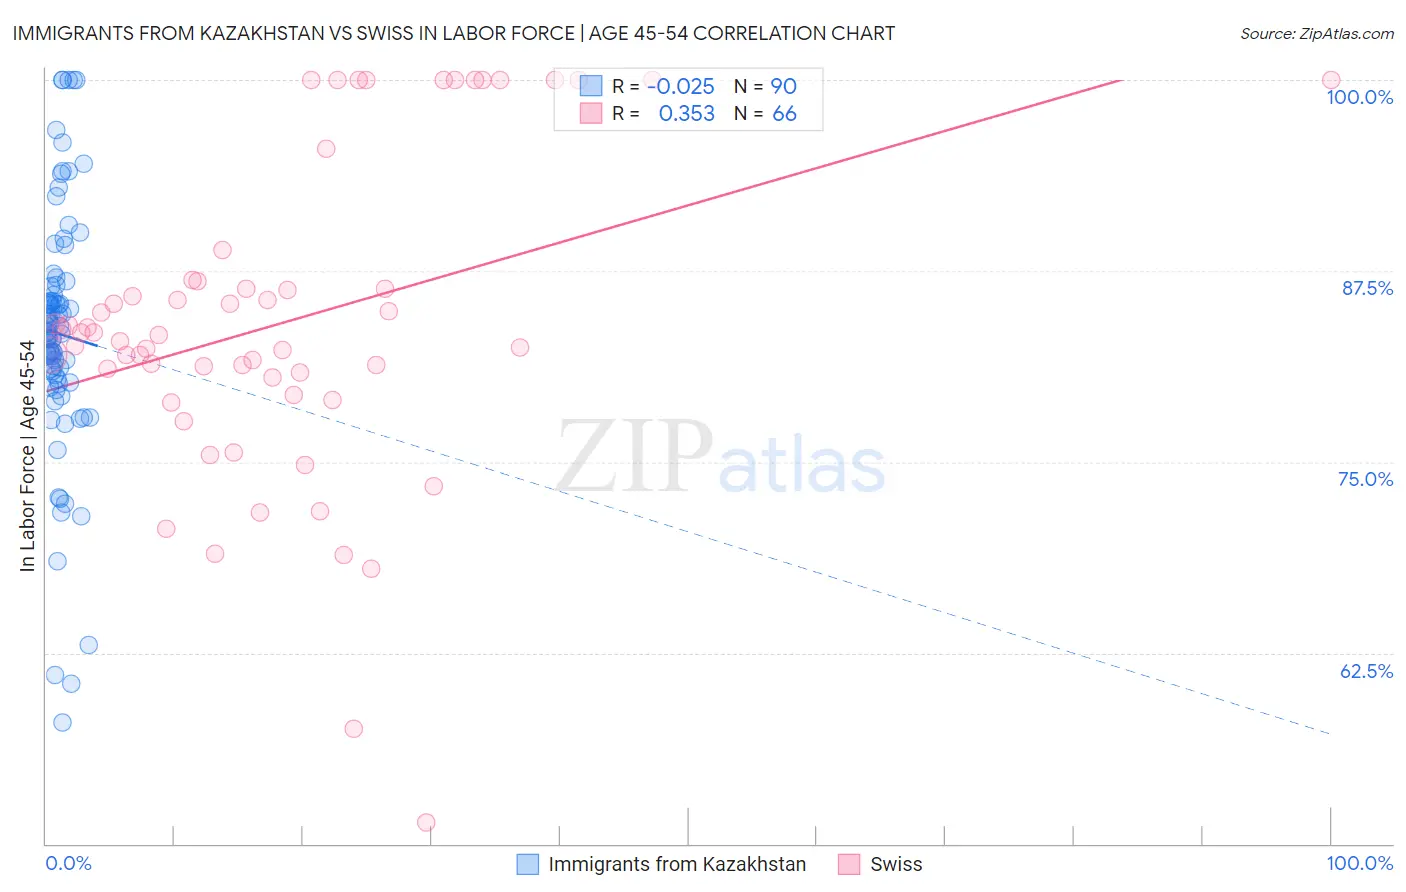
Immigrants from Kazakhstan vs Swiss In Labor Force | Age 45-54 Correlation Chart

The statistical analysis conducted on geographies consisting of 124,421,453 people shows no correlation between the proportion of Immigrants from Kazakhstan and labor force participation rate among population between the ages 45 and 54 in the United States with a correlation coefficient (R) of -0.025 and weighted average of 83.0%. Similarly, the statistical analysis conducted on geographies consisting of 464,737,366 people shows a mild positive correlation between the proportion of Swiss and labor force participation rate among population between the ages 45 and 54 in the United States with a correlation coefficient (R) of 0.353 and weighted average of 82.8%, a difference of 0.26%.
Immigrants from Kazakhstan vs Swiss In Labor Force | Age 45-54

In Labor Force | Age 45-54 Correlation Summary

MeasurementImmigrants from KazakhstanSwiss
Minimum57.9%51.4%
Maximum100.0%100.0%
Range42.1%48.6%
Mean83.4%84.1%
Median83.5%83.4%
Interquartile 25% (IQ1)80.4%80.5%
Interquartile 75% (IQ3)86.5%86.8%
Interquartile Range (IQR)6.0%6.3%
Standard Deviation (Sample)8.2%10.4%
Standard Deviation (Population)8.1%10.3%

Similar Demographics by In Labor Force | Age 45-54

Demographics Similar to Immigrants from Kazakhstan by In Labor Force | Age 45-54

In terms of in labor force | age 45-54, the demographic groups most similar to Immigrants from Kazakhstan are Austrian (83.0%, a difference of 0.0%), Sudanese (83.0%, a difference of 0.010%), Immigrants from Spain (83.0%, a difference of 0.010%), Ghanaian (83.0%, a difference of 0.020%), and Finnish (83.1%, a difference of 0.030%).
DemographicsRating | RankIn Labor Force | Age 45-54
Immigrants | Northern Europe
85.1
/100
|
#129
Excellent
83.1%
Immigrants | Israel
84.7
/100
|
#130
Excellent
83.1%
Finns
83.3
/100
|
#131
Excellent
83.1%
Immigrants | Ukraine
82.9
/100
|
#132
Excellent
83.0%
Liberians
82.7
/100
|
#133
Excellent
83.0%
Sudanese
82.0
/100
|
#134
Excellent
83.0%
Austrians
81.3
/100
|
#135
Excellent
83.0%
Immigrants | Kazakhstan
81.0
/100
|
#136
Excellent
83.0%
Immigrants | Spain
80.4
/100
|
#137
Excellent
83.0%
Ghanaians
79.5
/100
|
#138
Good
83.0%
Scandinavians
78.5
/100
|
#139
Good
83.0%
Yugoslavians
78.3
/100
|
#140
Good
83.0%
Immigrants | Haiti
77.9
/100
|
#141
Good
83.0%
Immigrants | Scotland
77.8
/100
|
#142
Good
83.0%
Okinawans
77.0
/100
|
#143
Good
83.0%

Demographics Similar to Swiss by In Labor Force | Age 45-54

In terms of in labor force | age 45-54, the demographic groups most similar to Swiss are Immigrants from South Eastern Asia (82.8%, a difference of 0.010%), Immigrants from South Africa (82.8%, a difference of 0.010%), Immigrants from Western Africa (82.8%, a difference of 0.020%), Immigrants from Sudan (82.8%, a difference of 0.030%), and Pakistani (82.8%, a difference of 0.030%).
DemographicsRating | RankIn Labor Force | Age 45-54
Laotians
62.8
/100
|
#160
Good
82.9%
South American Indians
62.2
/100
|
#161
Good
82.9%
Haitians
61.8
/100
|
#162
Good
82.8%
Dutch
61.7
/100
|
#163
Good
82.8%
German Russians
61.3
/100
|
#164
Good
82.8%
Immigrants | Sudan
59.9
/100
|
#165
Average
82.8%
Immigrants | South Eastern Asia
57.4
/100
|
#166
Average
82.8%
Swiss
56.5
/100
|
#167
Average
82.8%
Immigrants | South Africa
55.8
/100
|
#168
Average
82.8%
Immigrants | Western Africa
54.1
/100
|
#169
Average
82.8%
Pakistanis
53.2
/100
|
#170
Average
82.8%
Immigrants | Zaire
52.9
/100
|
#171
Average
82.8%
Icelanders
51.8
/100
|
#172
Average
82.8%
Nicaraguans
50.3
/100
|
#173
Average
82.8%
Costa Ricans
50.0
/100
|
#174
Average
82.8%