Immigrants from Grenada vs Immigrants from Eastern Europe In Labor Force | Age 30-34

COMPARE

Immigrants from Grenada
Race
Ancestry
AfghanAfricanAlaska NativeAlaskan AthabascanAlbanianAleutAlsatianAmericanApacheArabArapahoArgentineanArmenianAssyrian/Chaldean/SyriacAustralianAustrianBahamianBangladeshiBarbadianBasqueBelgianBelizeanBermudanBhutaneseBlackfeetBolivianBrazilianBritishBritish West IndianBulgarianBurmeseCajunCambodianCanadianCape VerdeanCarpatho RusynCelticCentral AmericanCentral American IndianCherokeeCheyenneChickasawChileanChineseChippewaChoctawColombianColvilleComancheCosta RicanCreeCreekCroatianCrowCubanCypriotCzechCzechoslovakianDanishDelawareDominicanDutchDutch West IndianEastern EuropeanEcuadorianEgyptianEnglishEstonianEthiopianEuropeanFijianFilipinoFinnishFrenchFrench American IndianFrench CanadianGermanGerman RussianGhanaianGreekGuamanian/ChamorroGuatemalanGuyaneseHaitianHmongHonduranHopiHoumaHungarianIcelanderIndian (Asian)IndonesianInupiatIranianIraqiIrishIroquoisIsraeliItalianJamaicanJapaneseJordanianKenyanKiowaKoreanLaotianLatvianLebaneseLiberianLithuanianLumbeeLuxembourgerMacedonianMalaysianMalteseMarshalleseMenomineeMexicanMexican American IndianMongolianMoroccanNative HawaiianNavajoNepaleseNew ZealanderNicaraguanNigerianNorthern EuropeanNorwegianOkinawanOsageOttawaPaiutePakistaniPalestinianPanamanianParaguayanPennsylvania GermanPeruvianPimaPolishPortuguesePotawatomiPuebloPuerto RicanPuget Sound SalishRomanianRussianSalvadoranSamoanScandinavianScotch-IrishScottishSeminoleSenegaleseSerbianShoshoneSierra LeoneanSiouxSlavicSlovakSloveneSomaliSouth AfricanSouth AmericanSouth American IndianSoviet UnionSpaniardSpanishSpanish AmericanSpanish American IndianSri LankanSubsaharan AfricanSudaneseSwedishSwissSyrianTaiwaneseThaiTlingit-HaidaTohono O'OdhamTonganTrinidadian and TobagonianTsimshianTurkishU.S. Virgin IslanderUgandanUkrainianUruguayanUteVenezuelanVietnameseWelshWest IndianYakamaYaquiYugoslavianYumanYup'ikZimbabwean
Immigration
NonimmigrantsImmigrantsAfghanistanAfricaAlbaniaArgentinaArmeniaAsiaAustraliaAustriaBahamasBangladeshBarbadosBelarusBelgiumBelizeBoliviaBosnia and HerzegovinaBrazilBulgariaBurma/MyanmarCabo VerdeCambodiaCameroonCanadaCaribbeanCentral AmericaChileChinaColombiaCongoCosta RicaCroatiaCubaCzechoslovakiaDenmarkDominicaDominican RepublicEastern AfricaEastern AsiaEcuadorEgyptEl SalvadorEnglandEritreaEthiopiaEuropeFijiFranceGermanyGhanaGreeceGrenadaGuatemalaGuyanaHaitiHondurasHong KongHungaryIndiaIndonesiaIranIraqIrelandIsraelItalyJamaicaJapanJordanKazakhstanKenyaKoreaKuwaitLaosLatin AmericaLatviaLebanonLiberiaLithuaniaMalaysiaMexicoMicronesiaMiddle AfricaMoldovaMoroccoNepalNetherlandsNicaraguaNigeriaNorth AmericaNorth MacedoniaNorthern AfricaNorthern EuropeNorwayOceaniaPakistanPanamaPeruPhilippinesPolandPortugalRomaniaRussiaSaudi ArabiaScotlandSenegalSerbiaSierra LeoneSingaporeSomaliaSouth AfricaSouth AmericaSouth Central AsiaSouth Eastern AsiaSouthern EuropeSpainSri LankaSt. Vincent and the GrenadinesSudanSwedenSwitzerlandSyriaTaiwanThailandTrinidad and TobagoTurkeyUgandaUkraineUruguayUzbekistanVenezuelaVietnamWest IndiesWestern AfricaWestern AsiaWestern EuropeYemenZaireZimbabweAzores
Immigrants from Eastern Europe
Race
Ancestry
AfghanAfricanAlaska NativeAlaskan AthabascanAlbanianAleutAlsatianAmericanApacheArabArapahoArgentineanArmenianAssyrian/Chaldean/SyriacAustralianAustrianBahamianBangladeshiBarbadianBasqueBelgianBelizeanBermudanBhutaneseBlackfeetBolivianBrazilianBritishBritish West IndianBulgarianBurmeseCajunCambodianCanadianCape VerdeanCarpatho RusynCelticCentral AmericanCentral American IndianCherokeeCheyenneChickasawChileanChineseChippewaChoctawColombianColvilleComancheCosta RicanCreeCreekCroatianCrowCubanCypriotCzechCzechoslovakianDanishDelawareDominicanDutchDutch West IndianEastern EuropeanEcuadorianEgyptianEnglishEstonianEthiopianEuropeanFijianFilipinoFinnishFrenchFrench American IndianFrench CanadianGermanGerman RussianGhanaianGreekGuamanian/ChamorroGuatemalanGuyaneseHaitianHmongHonduranHopiHoumaHungarianIcelanderIndian (Asian)IndonesianInupiatIranianIraqiIrishIroquoisIsraeliItalianJamaicanJapaneseJordanianKenyanKiowaKoreanLaotianLatvianLebaneseLiberianLithuanianLumbeeLuxembourgerMacedonianMalaysianMalteseMarshalleseMenomineeMexicanMexican American IndianMongolianMoroccanNative HawaiianNavajoNepaleseNew ZealanderNicaraguanNigerianNorthern EuropeanNorwegianOkinawanOsageOttawaPaiutePakistaniPalestinianPanamanianParaguayanPennsylvania GermanPeruvianPimaPolishPortuguesePotawatomiPuebloPuerto RicanPuget Sound SalishRomanianRussianSalvadoranSamoanScandinavianScotch-IrishScottishSeminoleSenegaleseSerbianShoshoneSierra LeoneanSiouxSlavicSlovakSloveneSomaliSouth AfricanSouth AmericanSouth American IndianSoviet UnionSpaniardSpanishSpanish AmericanSpanish American IndianSri LankanSubsaharan AfricanSudaneseSwedishSwissSyrianTaiwaneseThaiTlingit-HaidaTohono O'OdhamTonganTrinidadian and TobagonianTsimshianTurkishU.S. Virgin IslanderUgandanUkrainianUruguayanUteVenezuelanVietnameseWelshWest IndianYakamaYaquiYugoslavianYumanYup'ikZimbabwean
Immigration
NonimmigrantsImmigrantsAfghanistanAfricaAlbaniaArgentinaArmeniaAsiaAustraliaAustriaBahamasBangladeshBarbadosBelarusBelgiumBelizeBoliviaBosnia and HerzegovinaBrazilBulgariaBurma/MyanmarCabo VerdeCambodiaCameroonCanadaCaribbeanCentral AmericaChileChinaColombiaCongoCosta RicaCroatiaCubaCzechoslovakiaDenmarkDominicaDominican RepublicEastern AfricaEastern AsiaEastern EuropeEcuadorEgyptEl SalvadorEnglandEritreaEthiopiaEuropeFijiFranceGermanyGhanaGreeceGuatemalaGuyanaHaitiHondurasHong KongHungaryIndiaIndonesiaIranIraqIrelandIsraelItalyJamaicaJapanJordanKazakhstanKenyaKoreaKuwaitLaosLatin AmericaLatviaLebanonLiberiaLithuaniaMalaysiaMexicoMicronesiaMiddle AfricaMoldovaMoroccoNepalNetherlandsNicaraguaNigeriaNorth AmericaNorth MacedoniaNorthern AfricaNorthern EuropeNorwayOceaniaPakistanPanamaPeruPhilippinesPolandPortugalRomaniaRussiaSaudi ArabiaScotlandSenegalSerbiaSierra LeoneSingaporeSomaliaSouth AfricaSouth AmericaSouth Central AsiaSouth Eastern AsiaSouthern EuropeSpainSri LankaSt. Vincent and the GrenadinesSudanSwedenSwitzerlandSyriaTaiwanThailandTrinidad and TobagoTurkeyUgandaUkraineUruguayUzbekistanVenezuelaVietnamWest IndiesWestern AfricaWestern AsiaWestern EuropeYemenZaireZimbabweAzores
In Labor Force | Age 30-34
Income
Poverty
Unemployment
Labor Participation
Family Structure
Vehicle Availability
Education Level
Disability

In Labor Force | Age 30-34 Comparison

Immigrants from Grenada

Immigrants from Eastern Europe

Tragic
Exceptional
83.5%
IN LABOR FORCE | AGE 30-34
0.0/ 100
METRIC RATING
275th/ 347
METRIC RANK
85.4%
IN LABOR FORCE | AGE 30-34
99.3/ 100
METRIC RATING
68th/ 347
METRIC RANK

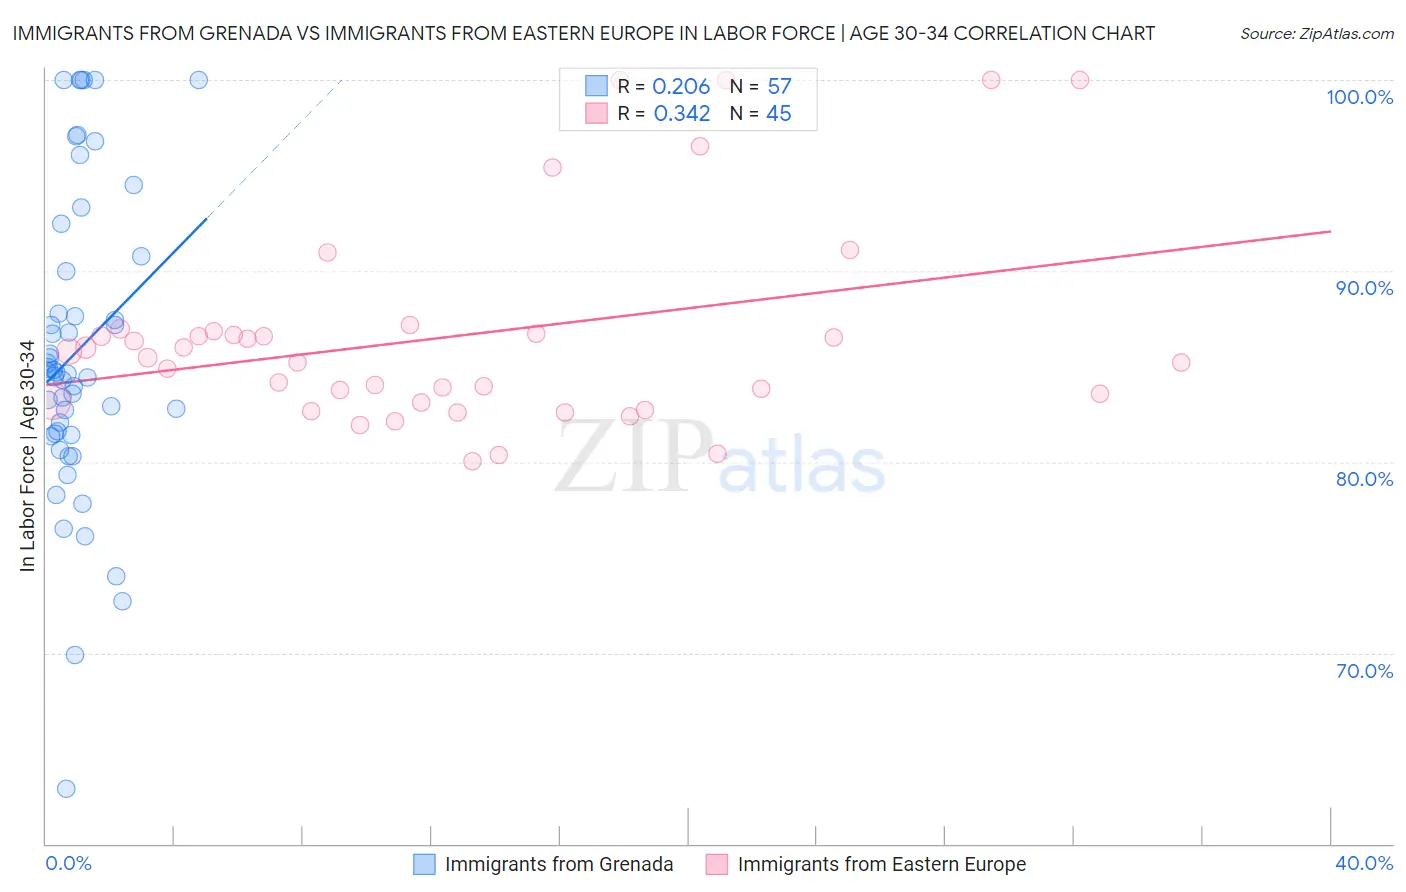
Immigrants from Grenada vs Immigrants from Eastern Europe In Labor Force | Age 30-34 Correlation Chart

The statistical analysis conducted on geographies consisting of 67,171,211 people shows a weak positive correlation between the proportion of Immigrants from Grenada and labor force participation rate among population between the ages 30 and 34 in the United States with a correlation coefficient (R) of 0.206 and weighted average of 83.5%. Similarly, the statistical analysis conducted on geographies consisting of 475,379,259 people shows a mild positive correlation between the proportion of Immigrants from Eastern Europe and labor force participation rate among population between the ages 30 and 34 in the United States with a correlation coefficient (R) of 0.342 and weighted average of 85.4%, a difference of 2.3%.
Immigrants from Grenada vs Immigrants from Eastern Europe In Labor Force | Age 30-34

In Labor Force | Age 30-34 Correlation Summary

MeasurementImmigrants from GrenadaImmigrants from Eastern Europe
Minimum62.9%80.0%
Maximum100.0%100.0%
Range37.1%20.0%
Mean85.8%86.6%
Median84.7%85.4%
Interquartile 25% (IQ1)81.4%83.1%
Interquartile 75% (IQ3)90.4%86.8%
Interquartile Range (IQR)9.0%3.6%
Standard Deviation (Sample)8.0%5.4%
Standard Deviation (Population)7.9%5.3%

Similar Demographics by In Labor Force | Age 30-34

Demographics Similar to Immigrants from Grenada by In Labor Force | Age 30-34

In terms of in labor force | age 30-34, the demographic groups most similar to Immigrants from Grenada are Belizean (83.5%, a difference of 0.010%), Tongan (83.5%, a difference of 0.010%), Guamanian/Chamorro (83.5%, a difference of 0.020%), Delaware (83.5%, a difference of 0.030%), and Spanish (83.5%, a difference of 0.070%).
DemographicsRating | RankIn Labor Force | Age 30-34
Immigrants | Bangladesh
0.1
/100
|
#268
Tragic
83.6%
Vietnamese
0.1
/100
|
#269
Tragic
83.6%
Spanish Americans
0.0
/100
|
#270
Tragic
83.5%
Spanish
0.0
/100
|
#271
Tragic
83.5%
Immigrants | Nonimmigrants
0.0
/100
|
#272
Tragic
83.5%
Guamanians/Chamorros
0.0
/100
|
#273
Tragic
83.5%
Belizeans
0.0
/100
|
#274
Tragic
83.5%
Immigrants | Grenada
0.0
/100
|
#275
Tragic
83.5%
Tongans
0.0
/100
|
#276
Tragic
83.5%
Delaware
0.0
/100
|
#277
Tragic
83.5%
Fijians
0.0
/100
|
#278
Tragic
83.4%
Immigrants | Fiji
0.0
/100
|
#279
Tragic
83.4%
Africans
0.0
/100
|
#280
Tragic
83.4%
Samoans
0.0
/100
|
#281
Tragic
83.3%
Mexican American Indians
0.0
/100
|
#282
Tragic
83.2%

Demographics Similar to Immigrants from Eastern Europe by In Labor Force | Age 30-34

In terms of in labor force | age 30-34, the demographic groups most similar to Immigrants from Eastern Europe are Ghanaian (85.4%, a difference of 0.010%), Kenyan (85.4%, a difference of 0.010%), Italian (85.4%, a difference of 0.020%), Senegalese (85.4%, a difference of 0.020%), and Macedonian (85.5%, a difference of 0.030%).
DemographicsRating | RankIn Labor Force | Age 30-34
Immigrants | Brazil
99.5
/100
|
#61
Exceptional
85.5%
Soviet Union
99.4
/100
|
#62
Exceptional
85.5%
Macedonians
99.4
/100
|
#63
Exceptional
85.5%
Italians
99.4
/100
|
#64
Exceptional
85.4%
Senegalese
99.4
/100
|
#65
Exceptional
85.4%
Ghanaians
99.4
/100
|
#66
Exceptional
85.4%
Kenyans
99.3
/100
|
#67
Exceptional
85.4%
Immigrants | Eastern Europe
99.3
/100
|
#68
Exceptional
85.4%
Immigrants | Iran
99.2
/100
|
#69
Exceptional
85.4%
Brazilians
99.1
/100
|
#70
Exceptional
85.4%
Immigrants | Japan
99.1
/100
|
#71
Exceptional
85.4%
Immigrants | China
99.0
/100
|
#72
Exceptional
85.4%
Indians (Asian)
99.0
/100
|
#73
Exceptional
85.4%
Maltese
99.0
/100
|
#74
Exceptional
85.4%
Immigrants | Czechoslovakia
99.0
/100
|
#75
Exceptional
85.4%