Immigrants from Grenada vs Immigrants from Eastern Europe Median Family Income

COMPARE

Immigrants from Grenada
Race
Ancestry
AfghanAfricanAlaska NativeAlaskan AthabascanAlbanianAleutAlsatianAmericanApacheArabArapahoArgentineanArmenianAssyrian/Chaldean/SyriacAustralianAustrianBahamianBangladeshiBarbadianBasqueBelgianBelizeanBermudanBhutaneseBlackfeetBolivianBrazilianBritishBritish West IndianBulgarianBurmeseCajunCambodianCanadianCape VerdeanCarpatho RusynCelticCentral AmericanCentral American IndianCherokeeCheyenneChickasawChileanChineseChippewaChoctawColombianColvilleComancheCosta RicanCreeCreekCroatianCrowCubanCypriotCzechCzechoslovakianDanishDelawareDominicanDutchDutch West IndianEastern EuropeanEcuadorianEgyptianEnglishEstonianEthiopianEuropeanFijianFilipinoFinnishFrenchFrench American IndianFrench CanadianGermanGerman RussianGhanaianGreekGuamanian/ChamorroGuatemalanGuyaneseHaitianHmongHonduranHopiHoumaHungarianIcelanderIndian (Asian)IndonesianInupiatIranianIraqiIrishIroquoisIsraeliItalianJamaicanJapaneseJordanianKenyanKiowaKoreanLaotianLatvianLebaneseLiberianLithuanianLumbeeLuxembourgerMacedonianMalaysianMalteseMarshalleseMenomineeMexicanMexican American IndianMongolianMoroccanNative HawaiianNavajoNepaleseNew ZealanderNicaraguanNigerianNorthern EuropeanNorwegianOkinawanOsageOttawaPaiutePakistaniPalestinianPanamanianParaguayanPennsylvania GermanPeruvianPimaPolishPortuguesePotawatomiPuebloPuerto RicanPuget Sound SalishRomanianRussianSalvadoranSamoanScandinavianScotch-IrishScottishSeminoleSenegaleseSerbianShoshoneSierra LeoneanSiouxSlavicSlovakSloveneSomaliSouth AfricanSouth AmericanSouth American IndianSoviet UnionSpaniardSpanishSpanish AmericanSpanish American IndianSri LankanSubsaharan AfricanSudaneseSwedishSwissSyrianTaiwaneseThaiTlingit-HaidaTohono O'OdhamTonganTrinidadian and TobagonianTsimshianTurkishU.S. Virgin IslanderUgandanUkrainianUruguayanUteVenezuelanVietnameseWelshWest IndianYakamaYaquiYugoslavianYumanYup'ikZimbabwean
Immigration
NonimmigrantsImmigrantsAfghanistanAfricaAlbaniaArgentinaArmeniaAsiaAustraliaAustriaBahamasBangladeshBarbadosBelarusBelgiumBelizeBoliviaBosnia and HerzegovinaBrazilBulgariaBurma/MyanmarCabo VerdeCambodiaCameroonCanadaCaribbeanCentral AmericaChileChinaColombiaCongoCosta RicaCroatiaCubaCzechoslovakiaDenmarkDominicaDominican RepublicEastern AfricaEastern AsiaEcuadorEgyptEl SalvadorEnglandEritreaEthiopiaEuropeFijiFranceGermanyGhanaGreeceGrenadaGuatemalaGuyanaHaitiHondurasHong KongHungaryIndiaIndonesiaIranIraqIrelandIsraelItalyJamaicaJapanJordanKazakhstanKenyaKoreaKuwaitLaosLatin AmericaLatviaLebanonLiberiaLithuaniaMalaysiaMexicoMicronesiaMiddle AfricaMoldovaMoroccoNepalNetherlandsNicaraguaNigeriaNorth AmericaNorth MacedoniaNorthern AfricaNorthern EuropeNorwayOceaniaPakistanPanamaPeruPhilippinesPolandPortugalRomaniaRussiaSaudi ArabiaScotlandSenegalSerbiaSierra LeoneSingaporeSomaliaSouth AfricaSouth AmericaSouth Central AsiaSouth Eastern AsiaSouthern EuropeSpainSri LankaSt. Vincent and the GrenadinesSudanSwedenSwitzerlandSyriaTaiwanThailandTrinidad and TobagoTurkeyUgandaUkraineUruguayUzbekistanVenezuelaVietnamWest IndiesWestern AfricaWestern AsiaWestern EuropeYemenZaireZimbabweAzores
Immigrants from Eastern Europe
Race
Ancestry
AfghanAfricanAlaska NativeAlaskan AthabascanAlbanianAleutAlsatianAmericanApacheArabArapahoArgentineanArmenianAssyrian/Chaldean/SyriacAustralianAustrianBahamianBangladeshiBarbadianBasqueBelgianBelizeanBermudanBhutaneseBlackfeetBolivianBrazilianBritishBritish West IndianBulgarianBurmeseCajunCambodianCanadianCape VerdeanCarpatho RusynCelticCentral AmericanCentral American IndianCherokeeCheyenneChickasawChileanChineseChippewaChoctawColombianColvilleComancheCosta RicanCreeCreekCroatianCrowCubanCypriotCzechCzechoslovakianDanishDelawareDominicanDutchDutch West IndianEastern EuropeanEcuadorianEgyptianEnglishEstonianEthiopianEuropeanFijianFilipinoFinnishFrenchFrench American IndianFrench CanadianGermanGerman RussianGhanaianGreekGuamanian/ChamorroGuatemalanGuyaneseHaitianHmongHonduranHopiHoumaHungarianIcelanderIndian (Asian)IndonesianInupiatIranianIraqiIrishIroquoisIsraeliItalianJamaicanJapaneseJordanianKenyanKiowaKoreanLaotianLatvianLebaneseLiberianLithuanianLumbeeLuxembourgerMacedonianMalaysianMalteseMarshalleseMenomineeMexicanMexican American IndianMongolianMoroccanNative HawaiianNavajoNepaleseNew ZealanderNicaraguanNigerianNorthern EuropeanNorwegianOkinawanOsageOttawaPaiutePakistaniPalestinianPanamanianParaguayanPennsylvania GermanPeruvianPimaPolishPortuguesePotawatomiPuebloPuerto RicanPuget Sound SalishRomanianRussianSalvadoranSamoanScandinavianScotch-IrishScottishSeminoleSenegaleseSerbianShoshoneSierra LeoneanSiouxSlavicSlovakSloveneSomaliSouth AfricanSouth AmericanSouth American IndianSoviet UnionSpaniardSpanishSpanish AmericanSpanish American IndianSri LankanSubsaharan AfricanSudaneseSwedishSwissSyrianTaiwaneseThaiTlingit-HaidaTohono O'OdhamTonganTrinidadian and TobagonianTsimshianTurkishU.S. Virgin IslanderUgandanUkrainianUruguayanUteVenezuelanVietnameseWelshWest IndianYakamaYaquiYugoslavianYumanYup'ikZimbabwean
Immigration
NonimmigrantsImmigrantsAfghanistanAfricaAlbaniaArgentinaArmeniaAsiaAustraliaAustriaBahamasBangladeshBarbadosBelarusBelgiumBelizeBoliviaBosnia and HerzegovinaBrazilBulgariaBurma/MyanmarCabo VerdeCambodiaCameroonCanadaCaribbeanCentral AmericaChileChinaColombiaCongoCosta RicaCroatiaCubaCzechoslovakiaDenmarkDominicaDominican RepublicEastern AfricaEastern AsiaEastern EuropeEcuadorEgyptEl SalvadorEnglandEritreaEthiopiaEuropeFijiFranceGermanyGhanaGreeceGuatemalaGuyanaHaitiHondurasHong KongHungaryIndiaIndonesiaIranIraqIrelandIsraelItalyJamaicaJapanJordanKazakhstanKenyaKoreaKuwaitLaosLatin AmericaLatviaLebanonLiberiaLithuaniaMalaysiaMexicoMicronesiaMiddle AfricaMoldovaMoroccoNepalNetherlandsNicaraguaNigeriaNorth AmericaNorth MacedoniaNorthern AfricaNorthern EuropeNorwayOceaniaPakistanPanamaPeruPhilippinesPolandPortugalRomaniaRussiaSaudi ArabiaScotlandSenegalSerbiaSierra LeoneSingaporeSomaliaSouth AfricaSouth AmericaSouth Central AsiaSouth Eastern AsiaSouthern EuropeSpainSri LankaSt. Vincent and the GrenadinesSudanSwedenSwitzerlandSyriaTaiwanThailandTrinidad and TobagoTurkeyUgandaUkraineUruguayUzbekistanVenezuelaVietnamWest IndiesWestern AfricaWestern AsiaWestern EuropeYemenZaireZimbabweAzores
Median Family Income
Income
Poverty
Unemployment
Labor Participation
Family Structure
Vehicle Availability
Education Level
Disability

Median Family Income Comparison

Immigrants from Grenada

Immigrants from Eastern Europe

Tragic
Exceptional
$89,249
MEDIAN FAMILY INCOME
0.1/ 100
METRIC RATING
278th/ 347
METRIC RANK
$112,527
MEDIAN FAMILY INCOME
99.4/ 100
METRIC RATING
77th/ 347
METRIC RANK

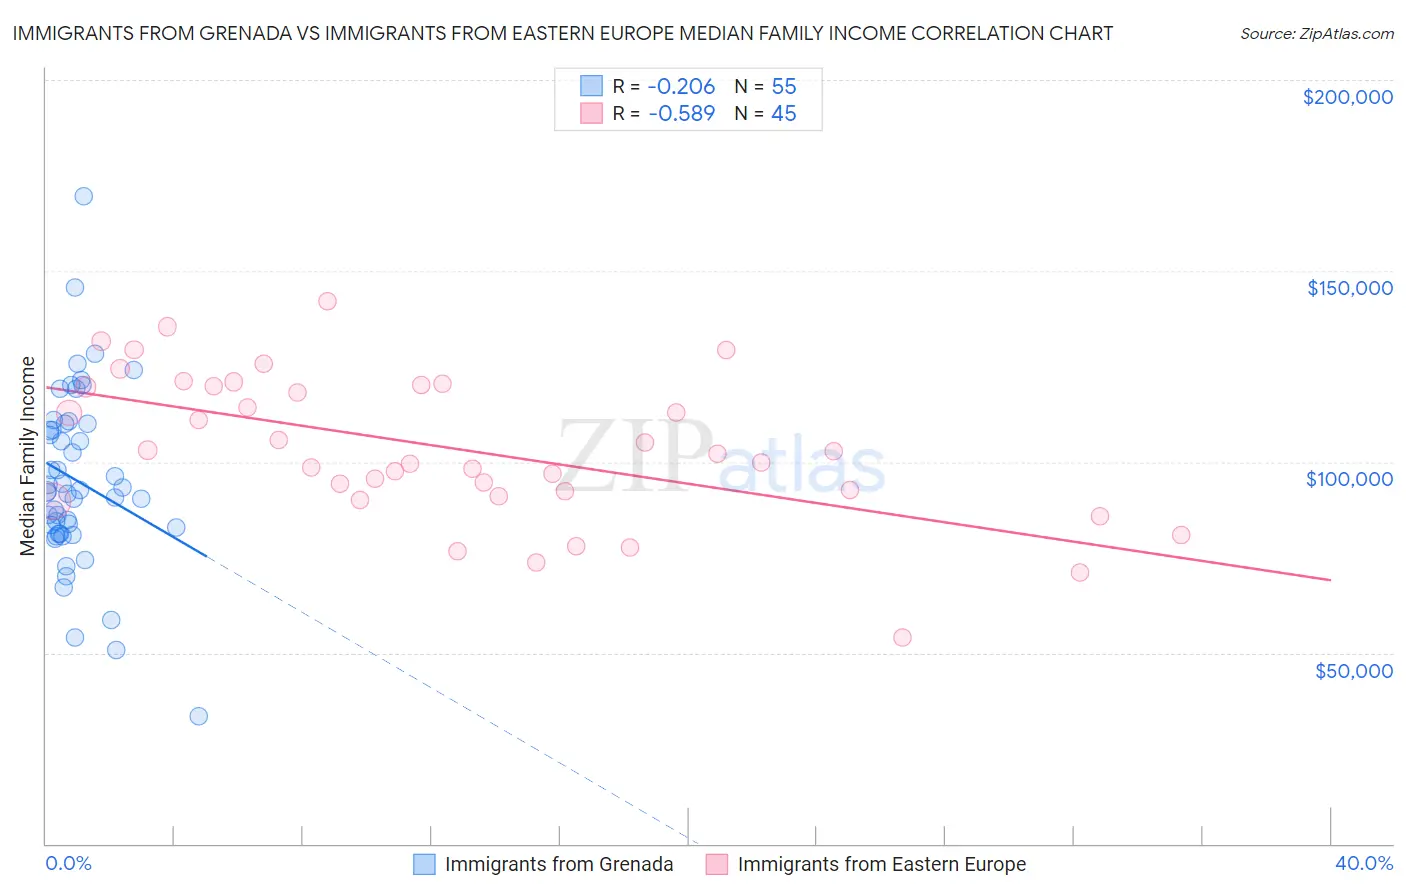
Immigrants from Grenada vs Immigrants from Eastern Europe Median Family Income Correlation Chart

The statistical analysis conducted on geographies consisting of 67,181,093 people shows a weak negative correlation between the proportion of Immigrants from Grenada and median family income in the United States with a correlation coefficient (R) of -0.206 and weighted average of $89,249. Similarly, the statistical analysis conducted on geographies consisting of 475,294,506 people shows a substantial negative correlation between the proportion of Immigrants from Eastern Europe and median family income in the United States with a correlation coefficient (R) of -0.589 and weighted average of $112,527, a difference of 26.1%.
Immigrants from Grenada vs Immigrants from Eastern Europe Median Family Income

Median Family Income Correlation Summary

MeasurementImmigrants from GrenadaImmigrants from Eastern Europe
Minimum$33,250$53,863
Maximum$169,583$142,041
Range$136,333$88,178
Mean$95,083$103,481
Median$92,174$102,281
Interquartile 25% (IQ1)$81,230$91,657
Interquartile 75% (IQ3)$109,949$119,896
Interquartile Range (IQR)$28,718$28,238
Standard Deviation (Sample)$23,232$19,233
Standard Deviation (Population)$23,020$19,018

Similar Demographics by Median Family Income

Demographics Similar to Immigrants from Grenada by Median Family Income

In terms of median family income, the demographic groups most similar to Immigrants from Grenada are Immigrants from Jamaica ($89,268, a difference of 0.020%), Immigrants from Zaire ($89,285, a difference of 0.040%), Immigrants from Belize ($89,197, a difference of 0.060%), British West Indian ($88,987, a difference of 0.29%), and Blackfeet ($88,717, a difference of 0.60%).
DemographicsRating | RankMedian Family Income
Iroquois
0.2
/100
|
#271
Tragic
$90,543
Immigrants | Liberia
0.2
/100
|
#272
Tragic
$90,450
Immigrants | Micronesia
0.2
/100
|
#273
Tragic
$90,345
Spanish Americans
0.2
/100
|
#274
Tragic
$90,322
Immigrants | St. Vincent and the Grenadines
0.2
/100
|
#275
Tragic
$90,094
Immigrants | Zaire
0.1
/100
|
#276
Tragic
$89,285
Immigrants | Jamaica
0.1
/100
|
#277
Tragic
$89,268
Immigrants | Grenada
0.1
/100
|
#278
Tragic
$89,249
Immigrants | Belize
0.1
/100
|
#279
Tragic
$89,197
British West Indians
0.1
/100
|
#280
Tragic
$88,987
Blackfeet
0.1
/100
|
#281
Tragic
$88,717
Comanche
0.1
/100
|
#282
Tragic
$88,556
Bangladeshis
0.1
/100
|
#283
Tragic
$88,358
Indonesians
0.1
/100
|
#284
Tragic
$88,301
Guatemalans
0.1
/100
|
#285
Tragic
$88,295

Demographics Similar to Immigrants from Eastern Europe by Median Family Income

In terms of median family income, the demographic groups most similar to Immigrants from Eastern Europe are Argentinean ($112,665, a difference of 0.12%), Immigrants from Western Europe ($112,688, a difference of 0.14%), Immigrants from Canada ($112,374, a difference of 0.14%), Italian ($112,372, a difference of 0.14%), and Immigrants from Croatia ($112,323, a difference of 0.18%).
DemographicsRating | RankMedian Family Income
Immigrants | Romania
99.6
/100
|
#70
Exceptional
$113,434
South Africans
99.5
/100
|
#71
Exceptional
$113,229
Afghans
99.5
/100
|
#72
Exceptional
$112,971
Laotians
99.5
/100
|
#73
Exceptional
$112,859
Immigrants | Italy
99.4
/100
|
#74
Exceptional
$112,848
Immigrants | Western Europe
99.4
/100
|
#75
Exceptional
$112,688
Argentineans
99.4
/100
|
#76
Exceptional
$112,665
Immigrants | Eastern Europe
99.4
/100
|
#77
Exceptional
$112,527
Immigrants | Canada
99.3
/100
|
#78
Exceptional
$112,374
Italians
99.3
/100
|
#79
Exceptional
$112,372
Immigrants | Croatia
99.3
/100
|
#80
Exceptional
$112,323
Immigrants | North America
99.2
/100
|
#81
Exceptional
$112,151
Immigrants | England
99.2
/100
|
#82
Exceptional
$112,038
Immigrants | Egypt
99.0
/100
|
#83
Exceptional
$111,689
Immigrants | Hungary
98.8
/100
|
#84
Exceptional
$111,378