Immigrants from Ghana vs Thai In Labor Force | Age 25-29

COMPARE

Immigrants from Ghana
Race
Ancestry
AfghanAfricanAlaska NativeAlaskan AthabascanAlbanianAleutAlsatianAmericanApacheArabArapahoArgentineanArmenianAssyrian/Chaldean/SyriacAustralianAustrianBahamianBangladeshiBarbadianBasqueBelgianBelizeanBermudanBhutaneseBlackfeetBolivianBrazilianBritishBritish West IndianBulgarianBurmeseCajunCambodianCanadianCape VerdeanCarpatho RusynCelticCentral AmericanCentral American IndianCherokeeCheyenneChickasawChileanChineseChippewaChoctawColombianColvilleComancheCosta RicanCreeCreekCroatianCrowCubanCypriotCzechCzechoslovakianDanishDelawareDominicanDutchDutch West IndianEastern EuropeanEcuadorianEgyptianEnglishEstonianEthiopianEuropeanFijianFilipinoFinnishFrenchFrench American IndianFrench CanadianGermanGerman RussianGhanaianGreekGuamanian/ChamorroGuatemalanGuyaneseHaitianHmongHonduranHopiHoumaHungarianIcelanderIndian (Asian)IndonesianInupiatIranianIraqiIrishIroquoisIsraeliItalianJamaicanJapaneseJordanianKenyanKiowaKoreanLaotianLatvianLebaneseLiberianLithuanianLumbeeLuxembourgerMacedonianMalaysianMalteseMarshalleseMenomineeMexicanMexican American IndianMongolianMoroccanNative HawaiianNavajoNepaleseNew ZealanderNicaraguanNigerianNorthern EuropeanNorwegianOkinawanOsageOttawaPaiutePakistaniPalestinianPanamanianParaguayanPennsylvania GermanPeruvianPimaPolishPortuguesePotawatomiPuebloPuerto RicanPuget Sound SalishRomanianRussianSalvadoranSamoanScandinavianScotch-IrishScottishSeminoleSenegaleseSerbianShoshoneSierra LeoneanSiouxSlavicSlovakSloveneSomaliSouth AfricanSouth AmericanSouth American IndianSoviet UnionSpaniardSpanishSpanish AmericanSpanish American IndianSri LankanSubsaharan AfricanSudaneseSwedishSwissSyrianTaiwaneseTlingit-HaidaTohono O'OdhamTonganTrinidadian and TobagonianTsimshianTurkishU.S. Virgin IslanderUgandanUkrainianUruguayanUteVenezuelanVietnameseWelshWest IndianYakamaYaquiYugoslavianYumanYup'ikZimbabwean
Immigration
NonimmigrantsImmigrantsAfghanistanAfricaAlbaniaArgentinaArmeniaAsiaAustraliaAustriaBahamasBangladeshBarbadosBelarusBelgiumBelizeBoliviaBosnia and HerzegovinaBrazilBulgariaBurma/MyanmarCabo VerdeCambodiaCameroonCanadaCaribbeanCentral AmericaChileChinaColombiaCongoCosta RicaCroatiaCubaCzechoslovakiaDenmarkDominicaDominican RepublicEastern AfricaEastern AsiaEastern EuropeEcuadorEgyptEl SalvadorEnglandEritreaEthiopiaEuropeFijiFranceGermanyGhanaGreeceGrenadaGuatemalaGuyanaHaitiHondurasHong KongHungaryIndiaIndonesiaIranIraqIrelandIsraelItalyJamaicaJapanJordanKazakhstanKenyaKoreaKuwaitLaosLatin AmericaLatviaLebanonLiberiaLithuaniaMalaysiaMexicoMicronesiaMiddle AfricaMoldovaMoroccoNepalNetherlandsNicaraguaNigeriaNorth AmericaNorth MacedoniaNorthern AfricaNorthern EuropeNorwayOceaniaPakistanPanamaPeruPhilippinesPolandPortugalRomaniaRussiaSaudi ArabiaScotlandSenegalSerbiaSierra LeoneSingaporeSomaliaSouth AfricaSouth AmericaSouth Central AsiaSouth Eastern AsiaSouthern EuropeSpainSri LankaSt. Vincent and the GrenadinesSudanSwedenSwitzerlandSyriaTaiwanThailandTrinidad and TobagoTurkeyUgandaUkraineUruguayUzbekistanVenezuelaVietnamWest IndiesWestern AfricaWestern AsiaWestern EuropeYemenZaireZimbabweAzores
Thai
Race
Ancestry
AfghanAfricanAlaska NativeAlaskan AthabascanAlbanianAleutAlsatianAmericanApacheArabArapahoArgentineanArmenianAssyrian/Chaldean/SyriacAustralianAustrianBahamianBangladeshiBarbadianBasqueBelgianBelizeanBermudanBhutaneseBlackfeetBolivianBrazilianBritishBritish West IndianBulgarianBurmeseCajunCambodianCanadianCape VerdeanCarpatho RusynCelticCentral AmericanCentral American IndianCherokeeCheyenneChickasawChileanChineseChippewaChoctawColombianColvilleComancheCosta RicanCreeCreekCroatianCrowCubanCypriotCzechCzechoslovakianDanishDelawareDominicanDutchDutch West IndianEastern EuropeanEcuadorianEgyptianEnglishEstonianEthiopianEuropeanFijianFilipinoFinnishFrenchFrench American IndianFrench CanadianGermanGerman RussianGhanaianGreekGuamanian/ChamorroGuatemalanGuyaneseHaitianHmongHonduranHopiHoumaHungarianIcelanderIndian (Asian)IndonesianInupiatIranianIraqiIrishIroquoisIsraeliItalianJamaicanJapaneseJordanianKenyanKiowaKoreanLaotianLatvianLebaneseLiberianLithuanianLumbeeLuxembourgerMacedonianMalaysianMalteseMarshalleseMenomineeMexicanMexican American IndianMongolianMoroccanNative HawaiianNavajoNepaleseNew ZealanderNicaraguanNigerianNorthern EuropeanNorwegianOkinawanOsageOttawaPaiutePakistaniPalestinianPanamanianParaguayanPennsylvania GermanPeruvianPimaPolishPortuguesePotawatomiPuebloPuerto RicanPuget Sound SalishRomanianRussianSalvadoranSamoanScandinavianScotch-IrishScottishSeminoleSenegaleseSerbianShoshoneSierra LeoneanSiouxSlavicSlovakSloveneSomaliSouth AfricanSouth AmericanSouth American IndianSoviet UnionSpaniardSpanishSpanish AmericanSpanish American IndianSri LankanSubsaharan AfricanSudaneseSwedishSwissSyrianTaiwaneseThaiTlingit-HaidaTohono O'OdhamTonganTrinidadian and TobagonianTsimshianTurkishU.S. Virgin IslanderUgandanUkrainianUruguayanUteVenezuelanVietnameseWelshWest IndianYakamaYaquiYugoslavianYumanYup'ikZimbabwean
Immigration
NonimmigrantsImmigrantsAfghanistanAfricaAlbaniaArgentinaArmeniaAsiaAustraliaAustriaBahamasBangladeshBarbadosBelarusBelgiumBelizeBoliviaBosnia and HerzegovinaBrazilBulgariaBurma/MyanmarCabo VerdeCambodiaCameroonCanadaCaribbeanCentral AmericaChileChinaColombiaCongoCosta RicaCroatiaCubaCzechoslovakiaDenmarkDominicaDominican RepublicEastern AfricaEastern AsiaEastern EuropeEcuadorEgyptEl SalvadorEnglandEritreaEthiopiaEuropeFijiFranceGermanyGreeceGrenadaGuatemalaGuyanaHaitiHondurasHong KongHungaryIndiaIndonesiaIranIraqIrelandIsraelItalyJamaicaJapanJordanKazakhstanKenyaKoreaKuwaitLaosLatin AmericaLatviaLebanonLiberiaLithuaniaMalaysiaMexicoMicronesiaMiddle AfricaMoldovaMoroccoNepalNetherlandsNicaraguaNigeriaNorth AmericaNorth MacedoniaNorthern AfricaNorthern EuropeNorwayOceaniaPakistanPanamaPeruPhilippinesPolandPortugalRomaniaRussiaSaudi ArabiaScotlandSenegalSerbiaSierra LeoneSingaporeSomaliaSouth AfricaSouth AmericaSouth Central AsiaSouth Eastern AsiaSouthern EuropeSpainSri LankaSt. Vincent and the GrenadinesSudanSwedenSwitzerlandSyriaTaiwanThailandTrinidad and TobagoTurkeyUgandaUkraineUruguayUzbekistanVenezuelaVietnamWest IndiesWestern AfricaWestern AsiaWestern EuropeYemenZaireZimbabweAzores
In Labor Force | Age 25-29
Income
Poverty
Unemployment
Labor Participation
Family Structure
Vehicle Availability
Education Level
Disability

In Labor Force | Age 25-29 Comparison

Immigrants from Ghana

Thais

Good
Exceptional
84.7%
IN LABOR FORCE | AGE 25-29
60.2/ 100
METRIC RATING
158th/ 347
METRIC RANK
85.5%
IN LABOR FORCE | AGE 25-29
99.5/ 100
METRIC RATING
60th/ 347
METRIC RANK

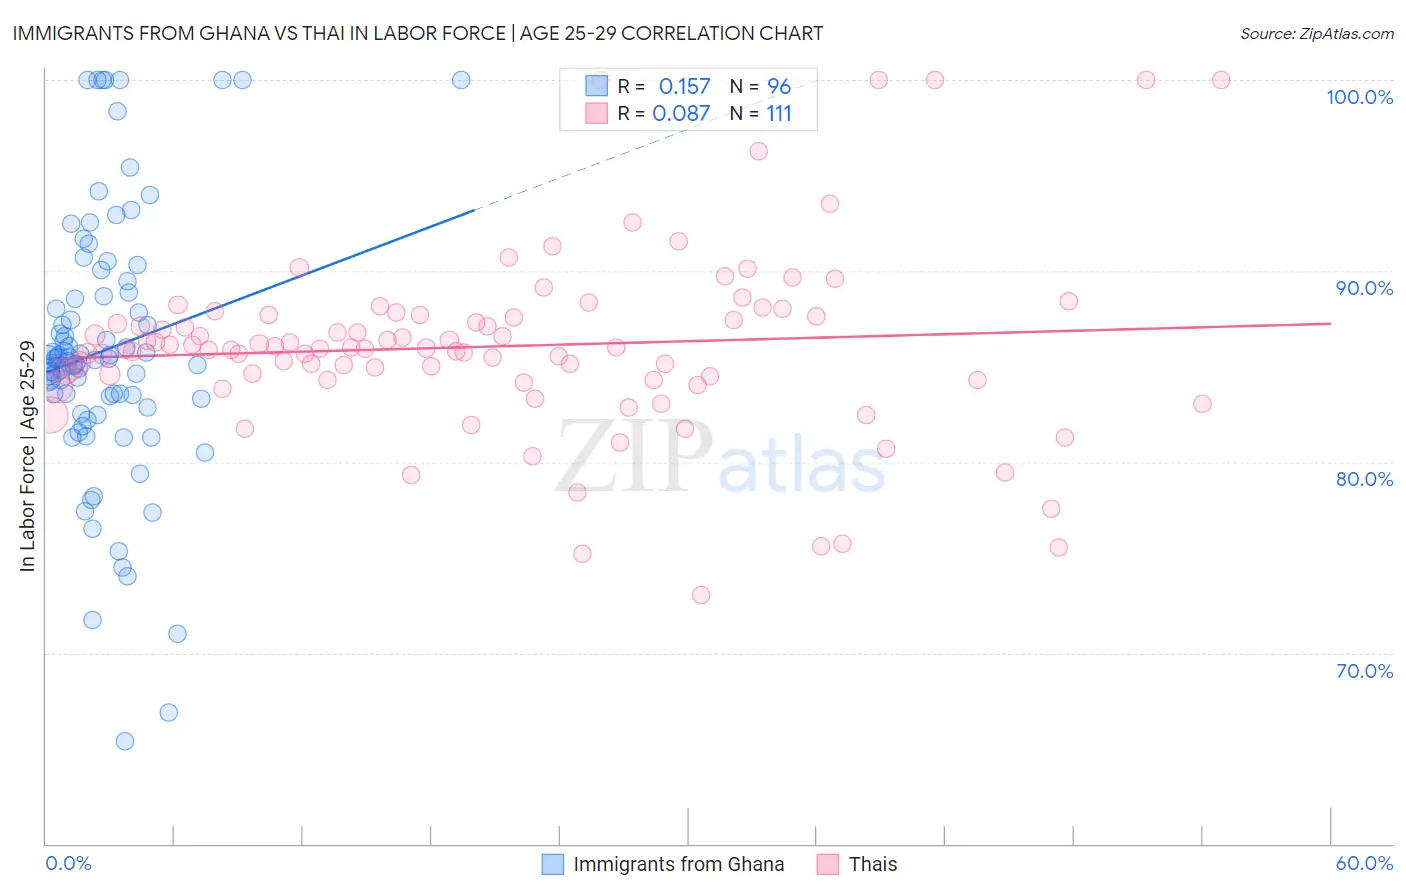
Immigrants from Ghana vs Thai In Labor Force | Age 25-29 Correlation Chart

The statistical analysis conducted on geographies consisting of 199,929,683 people shows a poor positive correlation between the proportion of Immigrants from Ghana and labor force participation rate among population between the ages 25 and 29 in the United States with a correlation coefficient (R) of 0.157 and weighted average of 84.7%. Similarly, the statistical analysis conducted on geographies consisting of 475,509,685 people shows a slight positive correlation between the proportion of Thais and labor force participation rate among population between the ages 25 and 29 in the United States with a correlation coefficient (R) of 0.087 and weighted average of 85.5%, a difference of 0.88%.
Immigrants from Ghana vs Thai In Labor Force | Age 25-29

In Labor Force | Age 25-29 Correlation Summary

MeasurementImmigrants from GhanaThai
Minimum65.4%73.0%
Maximum100.0%100.0%
Range34.6%27.0%
Mean85.9%86.0%
Median85.4%85.9%
Interquartile 25% (IQ1)83.1%84.3%
Interquartile 75% (IQ3)88.8%87.7%
Interquartile Range (IQR)5.7%3.4%
Standard Deviation (Sample)7.0%4.8%
Standard Deviation (Population)6.9%4.8%

Similar Demographics by In Labor Force | Age 25-29

Demographics Similar to Immigrants from Ghana by In Labor Force | Age 25-29

In terms of in labor force | age 25-29, the demographic groups most similar to Immigrants from Ghana are British (84.7%, a difference of 0.0%), Immigrants from Western Africa (84.7%, a difference of 0.0%), Immigrants from Sri Lanka (84.7%, a difference of 0.010%), Indian (Asian) (84.7%, a difference of 0.010%), and French (84.7%, a difference of 0.010%).
DemographicsRating | RankIn Labor Force | Age 25-29
Colombians
62.8
/100
|
#151
Good
84.7%
Immigrants | Pakistan
62.7
/100
|
#152
Good
84.7%
Immigrants | Taiwan
62.2
/100
|
#153
Good
84.7%
Immigrants | Sri Lanka
61.7
/100
|
#154
Good
84.7%
Indians (Asian)
61.6
/100
|
#155
Good
84.7%
French
61.0
/100
|
#156
Good
84.7%
British
60.4
/100
|
#157
Good
84.7%
Immigrants | Ghana
60.2
/100
|
#158
Good
84.7%
Immigrants | Western Africa
60.1
/100
|
#159
Good
84.7%
Immigrants | Peru
58.6
/100
|
#160
Average
84.7%
Canadians
58.5
/100
|
#161
Average
84.7%
Immigrants | Colombia
58.3
/100
|
#162
Average
84.7%
Argentineans
57.9
/100
|
#163
Average
84.7%
Ghanaians
57.6
/100
|
#164
Average
84.7%
Immigrants | Burma/Myanmar
57.4
/100
|
#165
Average
84.7%

Demographics Similar to Thais by In Labor Force | Age 25-29

In terms of in labor force | age 25-29, the demographic groups most similar to Thais are Serbian (85.5%, a difference of 0.0%), Taiwanese (85.4%, a difference of 0.020%), Immigrants from Kenya (85.4%, a difference of 0.020%), Immigrants from Morocco (85.5%, a difference of 0.030%), and Estonian (85.5%, a difference of 0.040%).
DemographicsRating | RankIn Labor Force | Age 25-29
Belgians
99.7
/100
|
#53
Exceptional
85.5%
Albanians
99.7
/100
|
#54
Exceptional
85.5%
Immigrants | Brazil
99.7
/100
|
#55
Exceptional
85.5%
Eastern Europeans
99.6
/100
|
#56
Exceptional
85.5%
Estonians
99.6
/100
|
#57
Exceptional
85.5%
Greeks
99.6
/100
|
#58
Exceptional
85.5%
Immigrants | Morocco
99.5
/100
|
#59
Exceptional
85.5%
Thais
99.5
/100
|
#60
Exceptional
85.5%
Serbians
99.5
/100
|
#61
Exceptional
85.5%
Taiwanese
99.4
/100
|
#62
Exceptional
85.4%
Immigrants | Kenya
99.4
/100
|
#63
Exceptional
85.4%
Immigrants | Italy
99.3
/100
|
#64
Exceptional
85.4%
Immigrants | Czechoslovakia
99.3
/100
|
#65
Exceptional
85.4%
Immigrants | Scotland
99.3
/100
|
#66
Exceptional
85.4%
Immigrants | Turkey
99.2
/100
|
#67
Exceptional
85.4%