Immigrants from Ethiopia vs Mongolian In Labor Force | Age 25-29

COMPARE

Immigrants from Ethiopia
Race
Ancestry
AfghanAfricanAlaska NativeAlaskan AthabascanAlbanianAleutAlsatianAmericanApacheArabArapahoArgentineanArmenianAssyrian/Chaldean/SyriacAustralianAustrianBahamianBangladeshiBarbadianBasqueBelgianBelizeanBermudanBhutaneseBlackfeetBolivianBrazilianBritishBritish West IndianBulgarianBurmeseCajunCambodianCanadianCape VerdeanCarpatho RusynCelticCentral AmericanCentral American IndianCherokeeCheyenneChickasawChileanChineseChippewaChoctawColombianColvilleComancheCosta RicanCreeCreekCroatianCrowCubanCypriotCzechCzechoslovakianDanishDelawareDominicanDutchDutch West IndianEastern EuropeanEcuadorianEgyptianEnglishEstonianEthiopianEuropeanFijianFilipinoFinnishFrenchFrench American IndianFrench CanadianGermanGerman RussianGhanaianGreekGuamanian/ChamorroGuatemalanGuyaneseHaitianHmongHonduranHopiHoumaHungarianIcelanderIndian (Asian)IndonesianInupiatIranianIraqiIrishIroquoisIsraeliItalianJamaicanJapaneseJordanianKenyanKiowaKoreanLaotianLatvianLebaneseLiberianLithuanianLumbeeLuxembourgerMacedonianMalaysianMalteseMarshalleseMenomineeMexicanMexican American IndianMoroccanNative HawaiianNavajoNepaleseNew ZealanderNicaraguanNigerianNorthern EuropeanNorwegianOkinawanOsageOttawaPaiutePakistaniPalestinianPanamanianParaguayanPennsylvania GermanPeruvianPimaPolishPortuguesePotawatomiPuebloPuerto RicanPuget Sound SalishRomanianRussianSalvadoranSamoanScandinavianScotch-IrishScottishSeminoleSenegaleseSerbianShoshoneSierra LeoneanSiouxSlavicSlovakSloveneSomaliSouth AfricanSouth AmericanSouth American IndianSoviet UnionSpaniardSpanishSpanish AmericanSpanish American IndianSri LankanSubsaharan AfricanSudaneseSwedishSwissSyrianTaiwaneseThaiTlingit-HaidaTohono O'OdhamTonganTrinidadian and TobagonianTsimshianTurkishU.S. Virgin IslanderUgandanUkrainianUruguayanUteVenezuelanVietnameseWelshWest IndianYakamaYaquiYugoslavianYumanYup'ikZimbabwean
Immigration
NonimmigrantsImmigrantsAfghanistanAfricaAlbaniaArgentinaArmeniaAsiaAustraliaAustriaBahamasBangladeshBarbadosBelarusBelgiumBelizeBoliviaBosnia and HerzegovinaBrazilBulgariaBurma/MyanmarCabo VerdeCambodiaCameroonCanadaCaribbeanCentral AmericaChileChinaColombiaCongoCosta RicaCroatiaCubaCzechoslovakiaDenmarkDominicaDominican RepublicEastern AfricaEastern AsiaEastern EuropeEcuadorEgyptEl SalvadorEnglandEritreaEthiopiaEuropeFijiFranceGermanyGhanaGreeceGrenadaGuatemalaGuyanaHaitiHondurasHong KongHungaryIndiaIndonesiaIranIraqIrelandIsraelItalyJamaicaJapanJordanKazakhstanKenyaKoreaKuwaitLaosLatin AmericaLatviaLebanonLiberiaLithuaniaMalaysiaMexicoMicronesiaMiddle AfricaMoldovaMoroccoNepalNetherlandsNicaraguaNigeriaNorth AmericaNorth MacedoniaNorthern AfricaNorthern EuropeNorwayOceaniaPakistanPanamaPeruPhilippinesPolandPortugalRomaniaRussiaSaudi ArabiaScotlandSenegalSerbiaSierra LeoneSingaporeSomaliaSouth AfricaSouth AmericaSouth Central AsiaSouth Eastern AsiaSouthern EuropeSpainSri LankaSt. Vincent and the GrenadinesSudanSwedenSwitzerlandSyriaTaiwanThailandTrinidad and TobagoTurkeyUgandaUkraineUruguayUzbekistanVenezuelaVietnamWest IndiesWestern AfricaWestern AsiaWestern EuropeYemenZaireZimbabweAzores
Mongolian
Race
Ancestry
AfghanAfricanAlaska NativeAlaskan AthabascanAlbanianAleutAlsatianAmericanApacheArabArapahoArgentineanArmenianAssyrian/Chaldean/SyriacAustralianAustrianBahamianBangladeshiBarbadianBasqueBelgianBelizeanBermudanBhutaneseBlackfeetBolivianBrazilianBritishBritish West IndianBulgarianBurmeseCajunCambodianCanadianCape VerdeanCarpatho RusynCelticCentral AmericanCentral American IndianCherokeeCheyenneChickasawChileanChineseChippewaChoctawColombianColvilleComancheCosta RicanCreeCreekCroatianCrowCubanCypriotCzechCzechoslovakianDanishDelawareDominicanDutchDutch West IndianEastern EuropeanEcuadorianEgyptianEnglishEstonianEthiopianEuropeanFijianFilipinoFinnishFrenchFrench American IndianFrench CanadianGermanGerman RussianGhanaianGreekGuamanian/ChamorroGuatemalanGuyaneseHaitianHmongHonduranHopiHoumaHungarianIcelanderIndian (Asian)IndonesianInupiatIranianIraqiIrishIroquoisIsraeliItalianJamaicanJapaneseJordanianKenyanKiowaKoreanLaotianLatvianLebaneseLiberianLithuanianLumbeeLuxembourgerMacedonianMalaysianMalteseMarshalleseMenomineeMexicanMexican American IndianMongolianMoroccanNative HawaiianNavajoNepaleseNew ZealanderNicaraguanNigerianNorthern EuropeanNorwegianOkinawanOsageOttawaPaiutePakistaniPalestinianPanamanianParaguayanPennsylvania GermanPeruvianPimaPolishPortuguesePotawatomiPuebloPuerto RicanPuget Sound SalishRomanianRussianSalvadoranSamoanScandinavianScotch-IrishScottishSeminoleSenegaleseSerbianShoshoneSierra LeoneanSiouxSlavicSlovakSloveneSomaliSouth AfricanSouth AmericanSouth American IndianSoviet UnionSpaniardSpanishSpanish AmericanSpanish American IndianSri LankanSubsaharan AfricanSudaneseSwedishSwissSyrianTaiwaneseThaiTlingit-HaidaTohono O'OdhamTonganTrinidadian and TobagonianTsimshianTurkishU.S. Virgin IslanderUgandanUkrainianUruguayanUteVenezuelanVietnameseWelshWest IndianYakamaYaquiYugoslavianYumanYup'ikZimbabwean
Immigration
NonimmigrantsImmigrantsAfghanistanAfricaAlbaniaArgentinaArmeniaAsiaAustraliaAustriaBahamasBangladeshBarbadosBelarusBelgiumBelizeBoliviaBosnia and HerzegovinaBrazilBulgariaBurma/MyanmarCabo VerdeCambodiaCameroonCanadaCaribbeanCentral AmericaChileChinaColombiaCongoCosta RicaCroatiaCubaCzechoslovakiaDenmarkDominicaDominican RepublicEastern AfricaEastern AsiaEastern EuropeEcuadorEgyptEl SalvadorEnglandEritreaEuropeFijiFranceGermanyGhanaGreeceGrenadaGuatemalaGuyanaHaitiHondurasHong KongHungaryIndiaIndonesiaIranIraqIrelandIsraelItalyJamaicaJapanJordanKazakhstanKenyaKoreaKuwaitLaosLatin AmericaLatviaLebanonLiberiaLithuaniaMalaysiaMexicoMicronesiaMiddle AfricaMoldovaMoroccoNepalNetherlandsNicaraguaNigeriaNorth AmericaNorth MacedoniaNorthern AfricaNorthern EuropeNorwayOceaniaPakistanPanamaPeruPhilippinesPolandPortugalRomaniaRussiaSaudi ArabiaScotlandSenegalSerbiaSierra LeoneSingaporeSomaliaSouth AfricaSouth AmericaSouth Central AsiaSouth Eastern AsiaSouthern EuropeSpainSri LankaSt. Vincent and the GrenadinesSudanSwedenSwitzerlandSyriaTaiwanThailandTrinidad and TobagoTurkeyUgandaUkraineUruguayUzbekistanVenezuelaVietnamWest IndiesWestern AfricaWestern AsiaWestern EuropeYemenZaireZimbabweAzores
In Labor Force | Age 25-29
Income
Poverty
Unemployment
Labor Participation
Family Structure
Vehicle Availability
Education Level
Disability

In Labor Force | Age 25-29 Comparison

Immigrants from Ethiopia

Mongolians

Exceptional
Exceptional
86.1%
IN LABOR FORCE | AGE 25-29
100.0/ 100
METRIC RATING
11th/ 347
METRIC RANK
85.1%
IN LABOR FORCE | AGE 25-29
94.1/ 100
METRIC RATING
98th/ 347
METRIC RANK

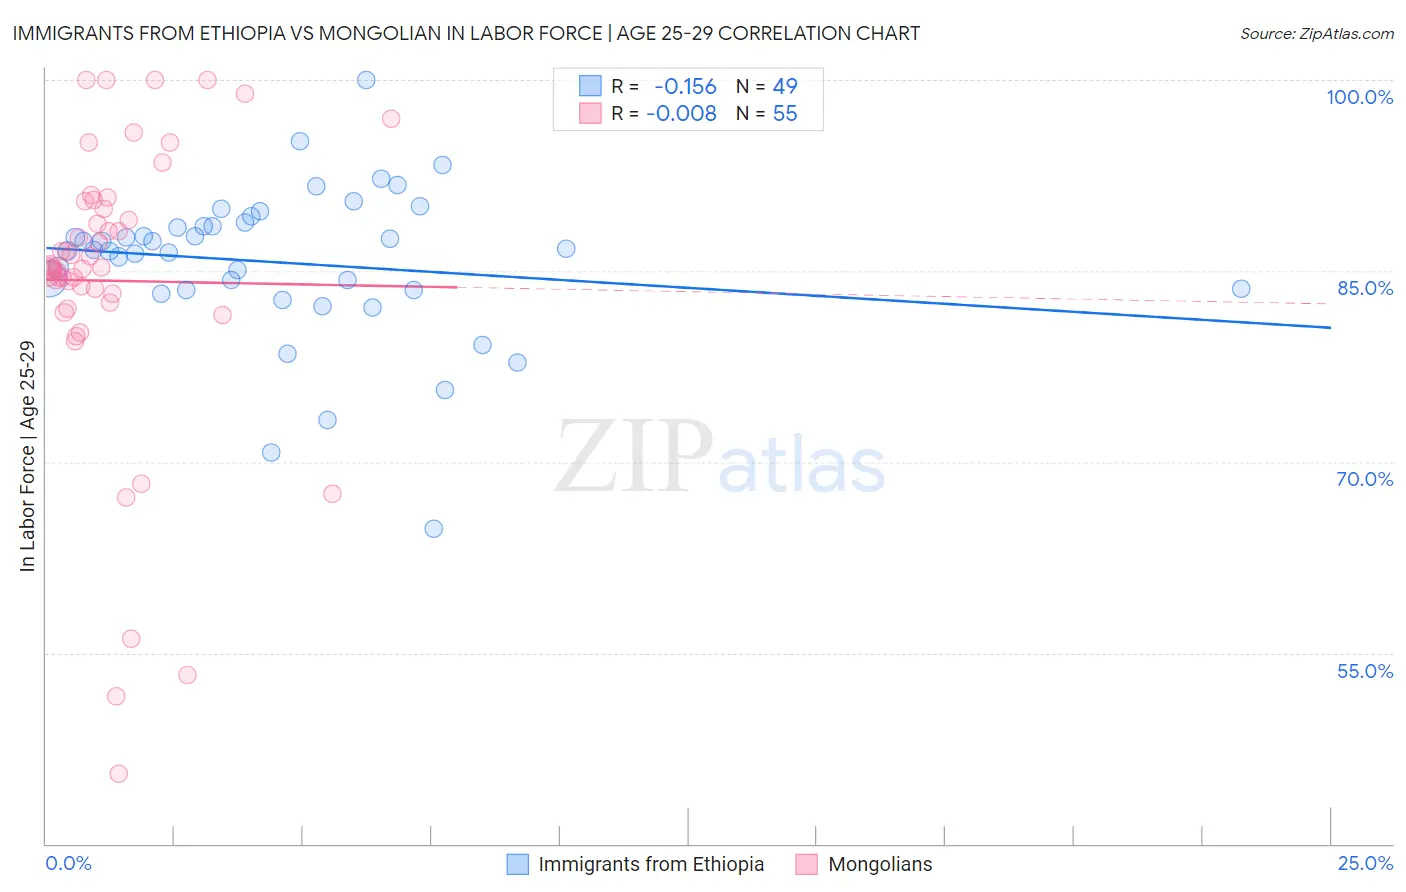
Immigrants from Ethiopia vs Mongolian In Labor Force | Age 25-29 Correlation Chart

The statistical analysis conducted on geographies consisting of 211,531,524 people shows a poor negative correlation between the proportion of Immigrants from Ethiopia and labor force participation rate among population between the ages 25 and 29 in the United States with a correlation coefficient (R) of -0.156 and weighted average of 86.1%. Similarly, the statistical analysis conducted on geographies consisting of 140,349,475 people shows no correlation between the proportion of Mongolians and labor force participation rate among population between the ages 25 and 29 in the United States with a correlation coefficient (R) of -0.008 and weighted average of 85.1%, a difference of 1.2%.
Immigrants from Ethiopia vs Mongolian In Labor Force | Age 25-29

In Labor Force | Age 25-29 Correlation Summary

MeasurementImmigrants from EthiopiaMongolian
Minimum64.7%45.5%
Maximum100.0%100.0%
Range35.3%54.5%
Mean85.7%84.2%
Median86.6%85.2%
Interquartile 25% (IQ1)83.5%82.5%
Interquartile 75% (IQ3)88.6%90.5%
Interquartile Range (IQR)5.2%8.0%
Standard Deviation (Sample)6.1%11.7%
Standard Deviation (Population)6.0%11.6%

Similar Demographics by In Labor Force | Age 25-29

Demographics Similar to Immigrants from Ethiopia by In Labor Force | Age 25-29

In terms of in labor force | age 25-29, the demographic groups most similar to Immigrants from Ethiopia are Liberian (86.1%, a difference of 0.0%), Immigrants from Lithuania (86.1%, a difference of 0.010%), Norwegian (86.1%, a difference of 0.020%), Ethiopian (86.2%, a difference of 0.050%), and Latvian (86.1%, a difference of 0.050%).
DemographicsRating | RankIn Labor Force | Age 25-29
Carpatho Rusyns
100.0
/100
|
#4
Exceptional
87.0%
Luxembourgers
100.0
/100
|
#5
Exceptional
86.9%
Slovenes
100.0
/100
|
#6
Exceptional
86.4%
Immigrants | Bosnia and Herzegovina
100.0
/100
|
#7
Exceptional
86.3%
Immigrants | Cabo Verde
100.0
/100
|
#8
Exceptional
86.2%
Ethiopians
100.0
/100
|
#9
Exceptional
86.2%
Liberians
100.0
/100
|
#10
Exceptional
86.1%
Immigrants | Ethiopia
100.0
/100
|
#11
Exceptional
86.1%
Immigrants | Lithuania
100.0
/100
|
#12
Exceptional
86.1%
Norwegians
100.0
/100
|
#13
Exceptional
86.1%
Latvians
100.0
/100
|
#14
Exceptional
86.1%
Bolivians
100.0
/100
|
#15
Exceptional
86.1%
Immigrants | Bolivia
100.0
/100
|
#16
Exceptional
86.1%
Bermudans
100.0
/100
|
#17
Exceptional
86.0%
Bulgarians
100.0
/100
|
#18
Exceptional
86.0%

Demographics Similar to Mongolians by In Labor Force | Age 25-29

In terms of in labor force | age 25-29, the demographic groups most similar to Mongolians are Bangladeshi (85.1%, a difference of 0.0%), Immigrants from Sudan (85.1%, a difference of 0.010%), Immigrants from Switzerland (85.1%, a difference of 0.010%), Egyptian (85.1%, a difference of 0.010%), and Slavic (85.1%, a difference of 0.010%).
DemographicsRating | RankIn Labor Force | Age 25-29
Immigrants | Moldova
95.8
/100
|
#91
Exceptional
85.1%
Immigrants | Costa Rica
95.5
/100
|
#92
Exceptional
85.1%
Austrians
95.3
/100
|
#93
Exceptional
85.1%
Immigrants | Korea
94.8
/100
|
#94
Exceptional
85.1%
Immigrants | Netherlands
94.6
/100
|
#95
Exceptional
85.1%
Immigrants | Romania
94.6
/100
|
#96
Exceptional
85.1%
Immigrants | Sudan
94.3
/100
|
#97
Exceptional
85.1%
Mongolians
94.1
/100
|
#98
Exceptional
85.1%
Bangladeshis
94.0
/100
|
#99
Exceptional
85.1%
Immigrants | Switzerland
93.9
/100
|
#100
Exceptional
85.1%
Egyptians
93.8
/100
|
#101
Exceptional
85.1%
Slavs
93.7
/100
|
#102
Exceptional
85.1%
Immigrants | Japan
93.5
/100
|
#103
Exceptional
85.1%
Immigrants | Zaire
93.3
/100
|
#104
Exceptional
85.1%
Immigrants | Hong Kong
92.8
/100
|
#105
Exceptional
85.0%