Immigrants from Egypt vs Immigrants from Barbados In Labor Force | Age 20-64

COMPARE

Immigrants from Egypt
Race
Ancestry
AfghanAfricanAlaska NativeAlaskan AthabascanAlbanianAleutAlsatianAmericanApacheArabArapahoArgentineanArmenianAssyrian/Chaldean/SyriacAustralianAustrianBahamianBangladeshiBarbadianBasqueBelgianBelizeanBermudanBhutaneseBlackfeetBolivianBrazilianBritishBritish West IndianBulgarianBurmeseCajunCambodianCanadianCape VerdeanCarpatho RusynCelticCentral AmericanCentral American IndianCherokeeCheyenneChickasawChileanChineseChippewaChoctawColombianColvilleComancheCosta RicanCreeCreekCroatianCrowCubanCypriotCzechCzechoslovakianDanishDelawareDominicanDutchDutch West IndianEastern EuropeanEcuadorianEgyptianEnglishEstonianEthiopianEuropeanFijianFilipinoFinnishFrenchFrench American IndianFrench CanadianGermanGerman RussianGhanaianGreekGuamanian/ChamorroGuatemalanGuyaneseHaitianHmongHonduranHopiHoumaHungarianIcelanderIndian (Asian)IndonesianInupiatIranianIraqiIrishIroquoisIsraeliItalianJamaicanJapaneseJordanianKenyanKiowaKoreanLaotianLatvianLebaneseLiberianLithuanianLumbeeLuxembourgerMacedonianMalaysianMalteseMarshalleseMenomineeMexicanMexican American IndianMongolianMoroccanNative HawaiianNavajoNepaleseNew ZealanderNicaraguanNigerianNorthern EuropeanNorwegianOkinawanOsageOttawaPaiutePakistaniPalestinianPanamanianParaguayanPennsylvania GermanPeruvianPimaPolishPortuguesePotawatomiPuebloPuerto RicanPuget Sound SalishRomanianRussianSalvadoranSamoanScandinavianScotch-IrishScottishSeminoleSenegaleseSerbianShoshoneSierra LeoneanSiouxSlavicSlovakSloveneSomaliSouth AfricanSouth AmericanSouth American IndianSoviet UnionSpaniardSpanishSpanish AmericanSpanish American IndianSri LankanSubsaharan AfricanSudaneseSwedishSwissSyrianTaiwaneseThaiTlingit-HaidaTohono O'OdhamTonganTrinidadian and TobagonianTsimshianTurkishU.S. Virgin IslanderUgandanUkrainianUruguayanUteVenezuelanVietnameseWelshWest IndianYakamaYaquiYugoslavianYumanYup'ikZimbabwean
Immigration
NonimmigrantsImmigrantsAfghanistanAfricaAlbaniaArgentinaArmeniaAsiaAustraliaAustriaBahamasBangladeshBelarusBelgiumBelizeBoliviaBosnia and HerzegovinaBrazilBulgariaBurma/MyanmarCabo VerdeCambodiaCameroonCanadaCaribbeanCentral AmericaChileChinaColombiaCongoCosta RicaCroatiaCubaCzechoslovakiaDenmarkDominicaDominican RepublicEastern AfricaEastern AsiaEastern EuropeEcuadorEgyptEl SalvadorEnglandEritreaEthiopiaEuropeFijiFranceGermanyGhanaGreeceGrenadaGuatemalaGuyanaHaitiHondurasHong KongHungaryIndiaIndonesiaIranIraqIrelandIsraelItalyJamaicaJapanJordanKazakhstanKenyaKoreaKuwaitLaosLatin AmericaLatviaLebanonLiberiaLithuaniaMalaysiaMexicoMicronesiaMiddle AfricaMoldovaMoroccoNepalNetherlandsNicaraguaNigeriaNorth AmericaNorth MacedoniaNorthern AfricaNorthern EuropeNorwayOceaniaPakistanPanamaPeruPhilippinesPolandPortugalRomaniaRussiaSaudi ArabiaScotlandSenegalSerbiaSierra LeoneSingaporeSomaliaSouth AfricaSouth AmericaSouth Central AsiaSouth Eastern AsiaSouthern EuropeSpainSri LankaSt. Vincent and the GrenadinesSudanSwedenSwitzerlandSyriaTaiwanThailandTrinidad and TobagoTurkeyUgandaUkraineUruguayUzbekistanVenezuelaVietnamWest IndiesWestern AfricaWestern AsiaWestern EuropeYemenZaireZimbabweAzores
Immigrants from Barbados
Race
Ancestry
AfghanAfricanAlaska NativeAlaskan AthabascanAlbanianAleutAlsatianAmericanApacheArabArapahoArgentineanArmenianAssyrian/Chaldean/SyriacAustralianAustrianBahamianBangladeshiBarbadianBasqueBelgianBelizeanBermudanBhutaneseBlackfeetBolivianBrazilianBritishBritish West IndianBulgarianBurmeseCajunCambodianCanadianCape VerdeanCarpatho RusynCelticCentral AmericanCentral American IndianCherokeeCheyenneChickasawChileanChineseChippewaChoctawColombianColvilleComancheCosta RicanCreeCreekCroatianCrowCubanCypriotCzechCzechoslovakianDanishDelawareDominicanDutchDutch West IndianEastern EuropeanEcuadorianEgyptianEnglishEstonianEthiopianEuropeanFijianFilipinoFinnishFrenchFrench American IndianFrench CanadianGermanGerman RussianGhanaianGreekGuamanian/ChamorroGuatemalanGuyaneseHaitianHmongHonduranHopiHoumaHungarianIcelanderIndian (Asian)IndonesianInupiatIranianIraqiIrishIroquoisIsraeliItalianJamaicanJapaneseJordanianKenyanKiowaKoreanLaotianLatvianLebaneseLiberianLithuanianLumbeeLuxembourgerMacedonianMalaysianMalteseMarshalleseMenomineeMexicanMexican American IndianMongolianMoroccanNative HawaiianNavajoNepaleseNew ZealanderNicaraguanNigerianNorthern EuropeanNorwegianOkinawanOsageOttawaPaiutePakistaniPalestinianPanamanianParaguayanPennsylvania GermanPeruvianPimaPolishPortuguesePotawatomiPuebloPuerto RicanPuget Sound SalishRomanianRussianSalvadoranSamoanScandinavianScotch-IrishScottishSeminoleSenegaleseSerbianShoshoneSierra LeoneanSiouxSlavicSlovakSloveneSomaliSouth AfricanSouth AmericanSouth American IndianSoviet UnionSpaniardSpanishSpanish AmericanSpanish American IndianSri LankanSubsaharan AfricanSudaneseSwedishSwissSyrianTaiwaneseThaiTlingit-HaidaTohono O'OdhamTonganTrinidadian and TobagonianTsimshianTurkishU.S. Virgin IslanderUgandanUkrainianUruguayanUteVenezuelanVietnameseWelshWest IndianYakamaYaquiYugoslavianYumanYup'ikZimbabwean
Immigration
NonimmigrantsImmigrantsAfghanistanAfricaAlbaniaArgentinaArmeniaAsiaAustraliaAustriaBahamasBangladeshBarbadosBelarusBelgiumBelizeBoliviaBosnia and HerzegovinaBrazilBulgariaBurma/MyanmarCabo VerdeCambodiaCameroonCanadaCaribbeanCentral AmericaChileChinaColombiaCongoCosta RicaCroatiaCubaCzechoslovakiaDenmarkDominicaDominican RepublicEastern AfricaEastern AsiaEastern EuropeEcuadorEl SalvadorEnglandEritreaEthiopiaEuropeFijiFranceGermanyGhanaGreeceGrenadaGuatemalaGuyanaHaitiHondurasHong KongHungaryIndiaIndonesiaIranIraqIrelandIsraelItalyJamaicaJapanJordanKazakhstanKenyaKoreaKuwaitLaosLatin AmericaLatviaLebanonLiberiaLithuaniaMalaysiaMexicoMicronesiaMiddle AfricaMoldovaMoroccoNepalNetherlandsNicaraguaNigeriaNorth AmericaNorth MacedoniaNorthern AfricaNorthern EuropeNorwayOceaniaPakistanPanamaPeruPhilippinesPolandPortugalRomaniaRussiaSaudi ArabiaScotlandSenegalSerbiaSierra LeoneSingaporeSomaliaSouth AfricaSouth AmericaSouth Central AsiaSouth Eastern AsiaSouthern EuropeSpainSri LankaSt. Vincent and the GrenadinesSudanSwedenSwitzerlandSyriaTaiwanThailandTrinidad and TobagoTurkeyUgandaUkraineUruguayUzbekistanVenezuelaVietnamWest IndiesWestern AfricaWestern AsiaWestern EuropeYemenZaireZimbabweAzores
In Labor Force | Age 20-64
Income
Poverty
Unemployment
Labor Participation
Family Structure
Vehicle Availability
Education Level
Disability

In Labor Force | Age 20-64 Comparison

Immigrants from Egypt

Immigrants from Barbados

Exceptional
Tragic
80.1%
IN LABOR FORCE | AGE 20-64
97.1/ 100
METRIC RATING
86th/ 347
METRIC RANK
78.3%
IN LABOR FORCE | AGE 20-64
0.0/ 100
METRIC RATING
269th/ 347
METRIC RANK

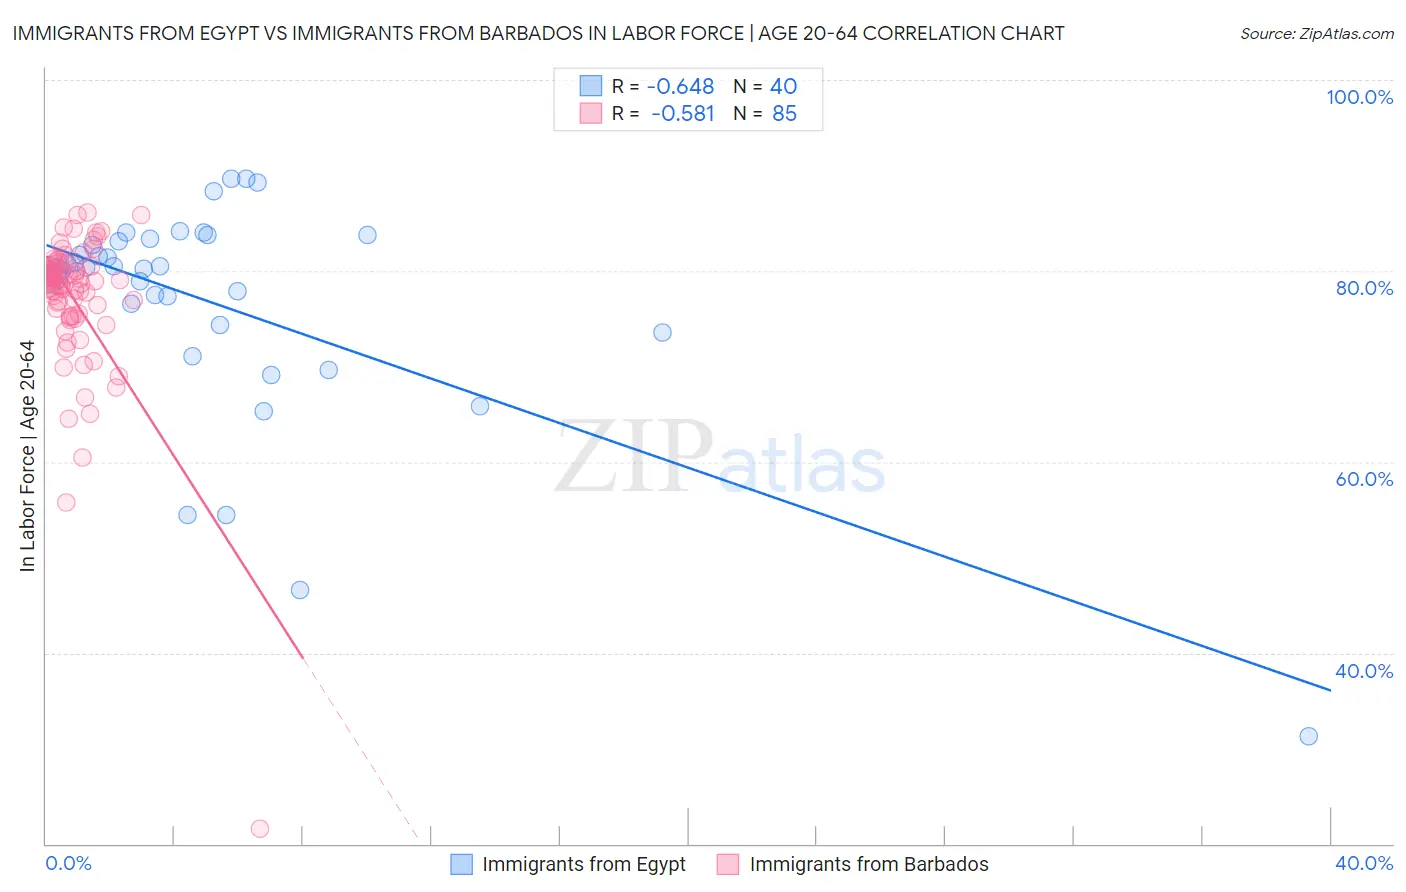
Immigrants from Egypt vs Immigrants from Barbados In Labor Force | Age 20-64 Correlation Chart

The statistical analysis conducted on geographies consisting of 245,492,161 people shows a significant negative correlation between the proportion of Immigrants from Egypt and labor force participation rate among population between the ages 20 and 64 in the United States with a correlation coefficient (R) of -0.648 and weighted average of 80.1%. Similarly, the statistical analysis conducted on geographies consisting of 112,778,506 people shows a substantial negative correlation between the proportion of Immigrants from Barbados and labor force participation rate among population between the ages 20 and 64 in the United States with a correlation coefficient (R) of -0.581 and weighted average of 78.3%, a difference of 2.3%.
Immigrants from Egypt vs Immigrants from Barbados In Labor Force | Age 20-64

In Labor Force | Age 20-64 Correlation Summary

MeasurementImmigrants from EgyptImmigrants from Barbados
Minimum31.3%21.6%
Maximum89.6%86.1%
Range58.3%64.5%
Mean76.4%77.0%
Median80.3%78.9%
Interquartile 25% (IQ1)73.9%75.4%
Interquartile 75% (IQ3)83.2%80.5%
Interquartile Range (IQR)9.3%5.1%
Standard Deviation (Sample)11.9%8.1%
Standard Deviation (Population)11.8%8.1%

Similar Demographics by In Labor Force | Age 20-64

Demographics Similar to Immigrants from Egypt by In Labor Force | Age 20-64

In terms of in labor force | age 20-64, the demographic groups most similar to Immigrants from Egypt are Jordanian (80.1%, a difference of 0.0%), Croatian (80.1%, a difference of 0.0%), German Russian (80.1%, a difference of 0.010%), Immigrants from Japan (80.1%, a difference of 0.010%), and Colombian (80.1%, a difference of 0.010%).
DemographicsRating | RankIn Labor Force | Age 20-64
Asians
97.7
/100
|
#79
Exceptional
80.2%
Immigrants | Croatia
97.6
/100
|
#80
Exceptional
80.1%
German Russians
97.3
/100
|
#81
Exceptional
80.1%
Immigrants | Japan
97.3
/100
|
#82
Exceptional
80.1%
Colombians
97.3
/100
|
#83
Exceptional
80.1%
Immigrants | Latvia
97.2
/100
|
#84
Exceptional
80.1%
Jordanians
97.2
/100
|
#85
Exceptional
80.1%
Immigrants | Egypt
97.1
/100
|
#86
Exceptional
80.1%
Croatians
97.1
/100
|
#87
Exceptional
80.1%
Chileans
97.0
/100
|
#88
Exceptional
80.1%
Immigrants | Venezuela
96.8
/100
|
#89
Exceptional
80.1%
Poles
96.8
/100
|
#90
Exceptional
80.1%
Uruguayans
96.7
/100
|
#91
Exceptional
80.1%
Ghanaians
96.7
/100
|
#92
Exceptional
80.1%
Immigrants | Belarus
96.4
/100
|
#93
Exceptional
80.1%

Demographics Similar to Immigrants from Barbados by In Labor Force | Age 20-64

In terms of in labor force | age 20-64, the demographic groups most similar to Immigrants from Barbados are Scotch-Irish (78.3%, a difference of 0.020%), Immigrants from Latin America (78.3%, a difference of 0.040%), Marshallese (78.3%, a difference of 0.040%), West Indian (78.3%, a difference of 0.050%), and U.S. Virgin Islander (78.4%, a difference of 0.070%).
DemographicsRating | RankIn Labor Force | Age 20-64
Fijians
0.1
/100
|
#262
Tragic
78.4%
Pennsylvania Germans
0.1
/100
|
#263
Tragic
78.4%
Spaniards
0.1
/100
|
#264
Tragic
78.4%
British West Indians
0.1
/100
|
#265
Tragic
78.4%
Bahamians
0.1
/100
|
#266
Tragic
78.4%
U.S. Virgin Islanders
0.1
/100
|
#267
Tragic
78.4%
West Indians
0.0
/100
|
#268
Tragic
78.3%
Immigrants | Barbados
0.0
/100
|
#269
Tragic
78.3%
Scotch-Irish
0.0
/100
|
#270
Tragic
78.3%
Immigrants | Latin America
0.0
/100
|
#271
Tragic
78.3%
Marshallese
0.0
/100
|
#272
Tragic
78.3%
French American Indians
0.0
/100
|
#273
Tragic
78.2%
Aleuts
0.0
/100
|
#274
Tragic
78.2%
Spanish
0.0
/100
|
#275
Tragic
78.2%
Puget Sound Salish
0.0
/100
|
#276
Tragic
78.2%