Immigrants from Eastern Africa vs Salvadoran In Labor Force | Age 20-24

COMPARE

Immigrants from Eastern Africa
Race
Ancestry
AfghanAfricanAlaska NativeAlaskan AthabascanAlbanianAleutAlsatianAmericanApacheArabArapahoArgentineanArmenianAssyrian/Chaldean/SyriacAustralianAustrianBahamianBangladeshiBarbadianBasqueBelgianBelizeanBermudanBhutaneseBlackfeetBolivianBrazilianBritishBritish West IndianBulgarianBurmeseCajunCambodianCanadianCape VerdeanCarpatho RusynCelticCentral AmericanCentral American IndianCherokeeCheyenneChickasawChileanChineseChippewaChoctawColombianColvilleComancheCosta RicanCreeCreekCroatianCrowCubanCypriotCzechCzechoslovakianDanishDelawareDominicanDutchDutch West IndianEastern EuropeanEcuadorianEgyptianEnglishEstonianEthiopianEuropeanFijianFilipinoFinnishFrenchFrench American IndianFrench CanadianGermanGerman RussianGhanaianGreekGuamanian/ChamorroGuatemalanGuyaneseHaitianHmongHonduranHopiHoumaHungarianIcelanderIndian (Asian)IndonesianInupiatIranianIraqiIrishIroquoisIsraeliItalianJamaicanJapaneseJordanianKenyanKiowaKoreanLaotianLatvianLebaneseLiberianLithuanianLumbeeLuxembourgerMacedonianMalaysianMalteseMarshalleseMenomineeMexicanMexican American IndianMongolianMoroccanNative HawaiianNavajoNepaleseNew ZealanderNicaraguanNigerianNorthern EuropeanNorwegianOkinawanOsageOttawaPaiutePakistaniPalestinianPanamanianParaguayanPennsylvania GermanPeruvianPimaPolishPortuguesePotawatomiPuebloPuerto RicanPuget Sound SalishRomanianRussianSamoanScandinavianScotch-IrishScottishSeminoleSenegaleseSerbianShoshoneSierra LeoneanSiouxSlavicSlovakSloveneSomaliSouth AfricanSouth AmericanSouth American IndianSoviet UnionSpaniardSpanishSpanish AmericanSpanish American IndianSri LankanSubsaharan AfricanSudaneseSwedishSwissSyrianTaiwaneseThaiTlingit-HaidaTohono O'OdhamTonganTrinidadian and TobagonianTsimshianTurkishU.S. Virgin IslanderUgandanUkrainianUruguayanUteVenezuelanVietnameseWelshWest IndianYakamaYaquiYugoslavianYumanYup'ikZimbabwean
Immigration
NonimmigrantsImmigrantsAfghanistanAfricaAlbaniaArgentinaArmeniaAsiaAustraliaAustriaBahamasBangladeshBarbadosBelarusBelgiumBelizeBoliviaBosnia and HerzegovinaBrazilBulgariaBurma/MyanmarCabo VerdeCambodiaCameroonCanadaCaribbeanCentral AmericaChileChinaColombiaCongoCosta RicaCroatiaCubaCzechoslovakiaDenmarkDominicaDominican RepublicEastern AfricaEastern AsiaEastern EuropeEcuadorEgyptEl SalvadorEnglandEritreaEthiopiaEuropeFijiFranceGermanyGhanaGreeceGrenadaGuatemalaGuyanaHaitiHondurasHong KongHungaryIndiaIndonesiaIranIraqIrelandIsraelItalyJamaicaJapanJordanKazakhstanKenyaKoreaKuwaitLaosLatin AmericaLatviaLebanonLiberiaLithuaniaMalaysiaMexicoMicronesiaMiddle AfricaMoldovaMoroccoNepalNetherlandsNicaraguaNigeriaNorth AmericaNorth MacedoniaNorthern AfricaNorthern EuropeNorwayOceaniaPakistanPanamaPeruPhilippinesPolandPortugalRomaniaRussiaSaudi ArabiaScotlandSenegalSerbiaSierra LeoneSingaporeSomaliaSouth AfricaSouth AmericaSouth Central AsiaSouth Eastern AsiaSouthern EuropeSpainSri LankaSt. Vincent and the GrenadinesSudanSwedenSwitzerlandSyriaTaiwanThailandTrinidad and TobagoTurkeyUgandaUkraineUruguayUzbekistanVenezuelaVietnamWest IndiesWestern AfricaWestern AsiaWestern EuropeYemenZaireZimbabweAzores
Salvadoran
Race
Ancestry
AfghanAfricanAlaska NativeAlaskan AthabascanAlbanianAleutAlsatianAmericanApacheArabArapahoArgentineanArmenianAssyrian/Chaldean/SyriacAustralianAustrianBahamianBangladeshiBarbadianBasqueBelgianBelizeanBermudanBhutaneseBlackfeetBolivianBrazilianBritishBritish West IndianBulgarianBurmeseCajunCambodianCanadianCape VerdeanCarpatho RusynCelticCentral AmericanCentral American IndianCherokeeCheyenneChickasawChileanChineseChippewaChoctawColombianColvilleComancheCosta RicanCreeCreekCroatianCrowCubanCypriotCzechCzechoslovakianDanishDelawareDominicanDutchDutch West IndianEastern EuropeanEcuadorianEgyptianEnglishEstonianEthiopianEuropeanFijianFilipinoFinnishFrenchFrench American IndianFrench CanadianGermanGerman RussianGhanaianGreekGuamanian/ChamorroGuatemalanGuyaneseHaitianHmongHonduranHopiHoumaHungarianIcelanderIndian (Asian)IndonesianInupiatIranianIraqiIrishIroquoisIsraeliItalianJamaicanJapaneseJordanianKenyanKiowaKoreanLaotianLatvianLebaneseLiberianLithuanianLumbeeLuxembourgerMacedonianMalaysianMalteseMarshalleseMenomineeMexicanMexican American IndianMongolianMoroccanNative HawaiianNavajoNepaleseNew ZealanderNicaraguanNigerianNorthern EuropeanNorwegianOkinawanOsageOttawaPaiutePakistaniPalestinianPanamanianParaguayanPennsylvania GermanPeruvianPimaPolishPortuguesePotawatomiPuebloPuerto RicanPuget Sound SalishRomanianRussianSalvadoranSamoanScandinavianScotch-IrishScottishSeminoleSenegaleseSerbianShoshoneSierra LeoneanSiouxSlavicSlovakSloveneSomaliSouth AfricanSouth AmericanSouth American IndianSoviet UnionSpaniardSpanishSpanish AmericanSpanish American IndianSri LankanSubsaharan AfricanSudaneseSwedishSwissSyrianTaiwaneseThaiTlingit-HaidaTohono O'OdhamTonganTrinidadian and TobagonianTsimshianTurkishU.S. Virgin IslanderUgandanUkrainianUruguayanUteVenezuelanVietnameseWelshWest IndianYakamaYaquiYugoslavianYumanYup'ikZimbabwean
Immigration
NonimmigrantsImmigrantsAfghanistanAfricaAlbaniaArgentinaArmeniaAsiaAustraliaAustriaBahamasBangladeshBarbadosBelarusBelgiumBelizeBoliviaBosnia and HerzegovinaBrazilBulgariaBurma/MyanmarCabo VerdeCambodiaCameroonCanadaCaribbeanCentral AmericaChileChinaColombiaCongoCosta RicaCroatiaCubaCzechoslovakiaDenmarkDominicaDominican RepublicEastern AsiaEastern EuropeEcuadorEgyptEl SalvadorEnglandEritreaEthiopiaEuropeFijiFranceGermanyGhanaGreeceGrenadaGuatemalaGuyanaHaitiHondurasHong KongHungaryIndiaIndonesiaIranIraqIrelandIsraelItalyJamaicaJapanJordanKazakhstanKenyaKoreaKuwaitLaosLatin AmericaLatviaLebanonLiberiaLithuaniaMalaysiaMexicoMicronesiaMiddle AfricaMoldovaMoroccoNepalNetherlandsNicaraguaNigeriaNorth AmericaNorth MacedoniaNorthern AfricaNorthern EuropeNorwayOceaniaPakistanPanamaPeruPhilippinesPolandPortugalRomaniaRussiaSaudi ArabiaScotlandSenegalSerbiaSierra LeoneSingaporeSomaliaSouth AfricaSouth AmericaSouth Central AsiaSouth Eastern AsiaSouthern EuropeSpainSri LankaSt. Vincent and the GrenadinesSudanSwedenSwitzerlandSyriaTaiwanThailandTrinidad and TobagoTurkeyUgandaUkraineUruguayUzbekistanVenezuelaVietnamWest IndiesWestern AfricaWestern AsiaWestern EuropeYemenZaireZimbabweAzores
In Labor Force | Age 20-24
Income
Poverty
Unemployment
Labor Participation
Family Structure
Vehicle Availability
Education Level
Disability

In Labor Force | Age 20-24 Comparison

Immigrants from Eastern Africa

Salvadorans

Exceptional
Good
77.5%
IN LABOR FORCE | AGE 20-24
100.0/ 100
METRIC RATING
35th/ 347
METRIC RANK
75.3%
IN LABOR FORCE | AGE 20-24
74.8/ 100
METRIC RATING
150th/ 347
METRIC RANK

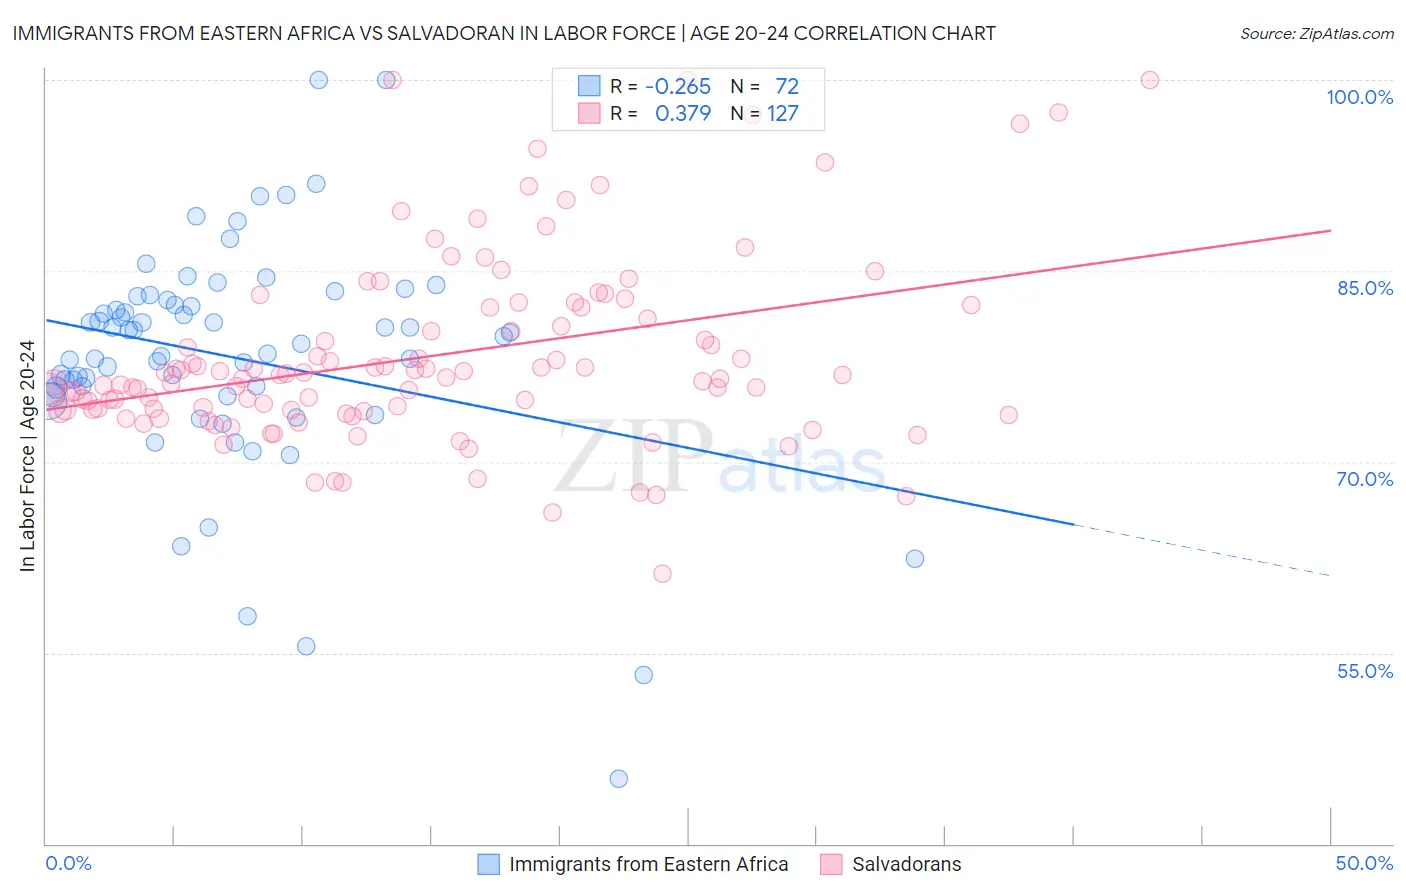
Immigrants from Eastern Africa vs Salvadoran In Labor Force | Age 20-24 Correlation Chart

The statistical analysis conducted on geographies consisting of 355,112,386 people shows a weak negative correlation between the proportion of Immigrants from Eastern Africa and labor force participation rate among population between the ages 20 and 24 in the United States with a correlation coefficient (R) of -0.265 and weighted average of 77.5%. Similarly, the statistical analysis conducted on geographies consisting of 398,945,167 people shows a mild positive correlation between the proportion of Salvadorans and labor force participation rate among population between the ages 20 and 24 in the United States with a correlation coefficient (R) of 0.379 and weighted average of 75.3%, a difference of 2.9%.
Immigrants from Eastern Africa vs Salvadoran In Labor Force | Age 20-24

In Labor Force | Age 20-24 Correlation Summary

MeasurementImmigrants from Eastern AfricaSalvadoran
Minimum45.1%61.2%
Maximum100.0%100.0%
Range54.9%38.8%
Mean78.2%78.3%
Median79.6%76.6%
Interquartile 25% (IQ1)75.6%74.1%
Interquartile 75% (IQ3)82.5%82.1%
Interquartile Range (IQR)6.9%8.0%
Standard Deviation (Sample)9.1%7.3%
Standard Deviation (Population)9.1%7.3%

Similar Demographics by In Labor Force | Age 20-24

Demographics Similar to Immigrants from Eastern Africa by In Labor Force | Age 20-24

In terms of in labor force | age 20-24, the demographic groups most similar to Immigrants from Eastern Africa are German Russian (77.5%, a difference of 0.010%), Immigrants from Ethiopia (77.5%, a difference of 0.020%), Welsh (77.5%, a difference of 0.020%), Czechoslovakian (77.5%, a difference of 0.030%), and English (77.6%, a difference of 0.070%).
DemographicsRating | RankIn Labor Force | Age 20-24
Belgians
100.0
/100
|
#28
Exceptional
77.8%
Slovaks
100.0
/100
|
#29
Exceptional
77.7%
Swiss
100.0
/100
|
#30
Exceptional
77.7%
Poles
100.0
/100
|
#31
Exceptional
77.6%
English
100.0
/100
|
#32
Exceptional
77.6%
Immigrants | Ethiopia
100.0
/100
|
#33
Exceptional
77.5%
German Russians
100.0
/100
|
#34
Exceptional
77.5%
Immigrants | Eastern Africa
100.0
/100
|
#35
Exceptional
77.5%
Welsh
100.0
/100
|
#36
Exceptional
77.5%
Czechoslovakians
100.0
/100
|
#37
Exceptional
77.5%
Marshallese
100.0
/100
|
#38
Exceptional
77.4%
Irish
100.0
/100
|
#39
Exceptional
77.4%
Scottish
100.0
/100
|
#40
Exceptional
77.4%
Immigrants | Congo
100.0
/100
|
#41
Exceptional
77.4%
French
100.0
/100
|
#42
Exceptional
77.4%

Demographics Similar to Salvadorans by In Labor Force | Age 20-24

In terms of in labor force | age 20-24, the demographic groups most similar to Salvadorans are Paiute (75.3%, a difference of 0.010%), Ugandan (75.4%, a difference of 0.020%), Lebanese (75.3%, a difference of 0.030%), Immigrants from Cambodia (75.4%, a difference of 0.040%), and Comanche (75.4%, a difference of 0.050%).
DemographicsRating | RankIn Labor Force | Age 20-24
Spaniards
82.0
/100
|
#143
Excellent
75.5%
Bhutanese
80.8
/100
|
#144
Excellent
75.4%
Koreans
79.7
/100
|
#145
Good
75.4%
Mexican American Indians
78.8
/100
|
#146
Good
75.4%
Comanche
77.6
/100
|
#147
Good
75.4%
Immigrants | Cambodia
76.7
/100
|
#148
Good
75.4%
Ugandans
76.1
/100
|
#149
Good
75.4%
Salvadorans
74.8
/100
|
#150
Good
75.3%
Paiute
74.1
/100
|
#151
Good
75.3%
Lebanese
73.5
/100
|
#152
Good
75.3%
Guatemalans
72.3
/100
|
#153
Good
75.3%
Osage
72.3
/100
|
#154
Good
75.3%
Immigrants | Guatemala
71.9
/100
|
#155
Good
75.3%
Immigrants | El Salvador
71.7
/100
|
#156
Good
75.3%
Immigrants | Western Europe
71.5
/100
|
#157
Good
75.3%