Crow vs Salvadoran In Labor Force | Age 20-24

COMPARE

Crow
Race
Ancestry
AfghanAfricanAlaska NativeAlaskan AthabascanAlbanianAleutAlsatianAmericanApacheArabArapahoArgentineanArmenianAssyrian/Chaldean/SyriacAustralianAustrianBahamianBangladeshiBarbadianBasqueBelgianBelizeanBermudanBhutaneseBlackfeetBolivianBrazilianBritishBritish West IndianBulgarianBurmeseCajunCambodianCanadianCape VerdeanCarpatho RusynCelticCentral AmericanCentral American IndianCherokeeCheyenneChickasawChileanChineseChippewaChoctawColombianColvilleComancheCosta RicanCreeCreekCroatianCrowCubanCypriotCzechCzechoslovakianDanishDelawareDominicanDutchDutch West IndianEastern EuropeanEcuadorianEgyptianEnglishEstonianEthiopianEuropeanFijianFilipinoFinnishFrenchFrench American IndianFrench CanadianGermanGerman RussianGhanaianGreekGuamanian/ChamorroGuatemalanGuyaneseHaitianHmongHonduranHopiHoumaHungarianIcelanderIndian (Asian)IndonesianInupiatIranianIraqiIrishIroquoisIsraeliItalianJamaicanJapaneseJordanianKenyanKiowaKoreanLaotianLatvianLebaneseLiberianLithuanianLumbeeLuxembourgerMacedonianMalaysianMalteseMarshalleseMenomineeMexicanMexican American IndianMongolianMoroccanNative HawaiianNavajoNepaleseNew ZealanderNicaraguanNigerianNorthern EuropeanNorwegianOkinawanOsageOttawaPaiutePakistaniPalestinianPanamanianParaguayanPennsylvania GermanPeruvianPimaPolishPortuguesePotawatomiPuebloPuerto RicanPuget Sound SalishRomanianRussianSamoanScandinavianScotch-IrishScottishSeminoleSenegaleseSerbianShoshoneSierra LeoneanSiouxSlavicSlovakSloveneSomaliSouth AfricanSouth AmericanSouth American IndianSoviet UnionSpaniardSpanishSpanish AmericanSpanish American IndianSri LankanSubsaharan AfricanSudaneseSwedishSwissSyrianTaiwaneseThaiTlingit-HaidaTohono O'OdhamTonganTrinidadian and TobagonianTsimshianTurkishU.S. Virgin IslanderUgandanUkrainianUruguayanUteVenezuelanVietnameseWelshWest IndianYakamaYaquiYugoslavianYumanYup'ikZimbabwean
Immigration
NonimmigrantsImmigrantsAfghanistanAfricaAlbaniaArgentinaArmeniaAsiaAustraliaAustriaBahamasBangladeshBarbadosBelarusBelgiumBelizeBoliviaBosnia and HerzegovinaBrazilBulgariaBurma/MyanmarCabo VerdeCambodiaCameroonCanadaCaribbeanCentral AmericaChileChinaColombiaCongoCosta RicaCroatiaCubaCzechoslovakiaDenmarkDominicaDominican RepublicEastern AfricaEastern AsiaEastern EuropeEcuadorEgyptEl SalvadorEnglandEritreaEthiopiaEuropeFijiFranceGermanyGhanaGreeceGrenadaGuatemalaGuyanaHaitiHondurasHong KongHungaryIndiaIndonesiaIranIraqIrelandIsraelItalyJamaicaJapanJordanKazakhstanKenyaKoreaKuwaitLaosLatin AmericaLatviaLebanonLiberiaLithuaniaMalaysiaMexicoMicronesiaMiddle AfricaMoldovaMoroccoNepalNetherlandsNicaraguaNigeriaNorth AmericaNorth MacedoniaNorthern AfricaNorthern EuropeNorwayOceaniaPakistanPanamaPeruPhilippinesPolandPortugalRomaniaRussiaSaudi ArabiaScotlandSenegalSerbiaSierra LeoneSingaporeSomaliaSouth AfricaSouth AmericaSouth Central AsiaSouth Eastern AsiaSouthern EuropeSpainSri LankaSt. Vincent and the GrenadinesSudanSwedenSwitzerlandSyriaTaiwanThailandTrinidad and TobagoTurkeyUgandaUkraineUruguayUzbekistanVenezuelaVietnamWest IndiesWestern AfricaWestern AsiaWestern EuropeYemenZaireZimbabweAzores
Salvadoran
Race
Ancestry
AfghanAfricanAlaska NativeAlaskan AthabascanAlbanianAleutAlsatianAmericanApacheArabArapahoArgentineanArmenianAssyrian/Chaldean/SyriacAustralianAustrianBahamianBangladeshiBarbadianBasqueBelgianBelizeanBermudanBhutaneseBlackfeetBolivianBrazilianBritishBritish West IndianBulgarianBurmeseCajunCambodianCanadianCape VerdeanCarpatho RusynCelticCentral AmericanCentral American IndianCherokeeCheyenneChickasawChileanChineseChippewaChoctawColombianColvilleComancheCosta RicanCreeCreekCroatianCubanCypriotCzechCzechoslovakianDanishDelawareDominicanDutchDutch West IndianEastern EuropeanEcuadorianEgyptianEnglishEstonianEthiopianEuropeanFijianFilipinoFinnishFrenchFrench American IndianFrench CanadianGermanGerman RussianGhanaianGreekGuamanian/ChamorroGuatemalanGuyaneseHaitianHmongHonduranHopiHoumaHungarianIcelanderIndian (Asian)IndonesianInupiatIranianIraqiIrishIroquoisIsraeliItalianJamaicanJapaneseJordanianKenyanKiowaKoreanLaotianLatvianLebaneseLiberianLithuanianLumbeeLuxembourgerMacedonianMalaysianMalteseMarshalleseMenomineeMexicanMexican American IndianMongolianMoroccanNative HawaiianNavajoNepaleseNew ZealanderNicaraguanNigerianNorthern EuropeanNorwegianOkinawanOsageOttawaPaiutePakistaniPalestinianPanamanianParaguayanPennsylvania GermanPeruvianPimaPolishPortuguesePotawatomiPuebloPuerto RicanPuget Sound SalishRomanianRussianSalvadoranSamoanScandinavianScotch-IrishScottishSeminoleSenegaleseSerbianShoshoneSierra LeoneanSiouxSlavicSlovakSloveneSomaliSouth AfricanSouth AmericanSouth American IndianSoviet UnionSpaniardSpanishSpanish AmericanSpanish American IndianSri LankanSubsaharan AfricanSudaneseSwedishSwissSyrianTaiwaneseThaiTlingit-HaidaTohono O'OdhamTonganTrinidadian and TobagonianTsimshianTurkishU.S. Virgin IslanderUgandanUkrainianUruguayanUteVenezuelanVietnameseWelshWest IndianYakamaYaquiYugoslavianYumanYup'ikZimbabwean
Immigration
NonimmigrantsImmigrantsAfghanistanAfricaAlbaniaArgentinaArmeniaAsiaAustraliaAustriaBahamasBangladeshBarbadosBelarusBelgiumBelizeBoliviaBosnia and HerzegovinaBrazilBulgariaBurma/MyanmarCabo VerdeCambodiaCameroonCanadaCaribbeanCentral AmericaChileChinaColombiaCongoCosta RicaCroatiaCubaCzechoslovakiaDenmarkDominicaDominican RepublicEastern AfricaEastern AsiaEastern EuropeEcuadorEgyptEl SalvadorEnglandEritreaEthiopiaEuropeFijiFranceGermanyGhanaGreeceGrenadaGuatemalaGuyanaHaitiHondurasHong KongHungaryIndiaIndonesiaIranIraqIrelandIsraelItalyJamaicaJapanJordanKazakhstanKenyaKoreaKuwaitLaosLatin AmericaLatviaLebanonLiberiaLithuaniaMalaysiaMexicoMicronesiaMiddle AfricaMoldovaMoroccoNepalNetherlandsNicaraguaNigeriaNorth AmericaNorth MacedoniaNorthern AfricaNorthern EuropeNorwayOceaniaPakistanPanamaPeruPhilippinesPolandPortugalRomaniaRussiaSaudi ArabiaScotlandSenegalSerbiaSierra LeoneSingaporeSomaliaSouth AfricaSouth AmericaSouth Central AsiaSouth Eastern AsiaSouthern EuropeSpainSri LankaSt. Vincent and the GrenadinesSudanSwedenSwitzerlandSyriaTaiwanThailandTrinidad and TobagoTurkeyUgandaUkraineUruguayUzbekistanVenezuelaVietnamWest IndiesWestern AfricaWestern AsiaWestern EuropeYemenZaireZimbabweAzores
In Labor Force | Age 20-24
Income
Poverty
Unemployment
Labor Participation
Family Structure
Vehicle Availability
Education Level
Disability

In Labor Force | Age 20-24 Comparison

Crow

Salvadorans

Exceptional
Good
76.9%
IN LABOR FORCE | AGE 20-24
99.9/ 100
METRIC RATING
65th/ 347
METRIC RANK
75.3%
IN LABOR FORCE | AGE 20-24
74.8/ 100
METRIC RATING
150th/ 347
METRIC RANK

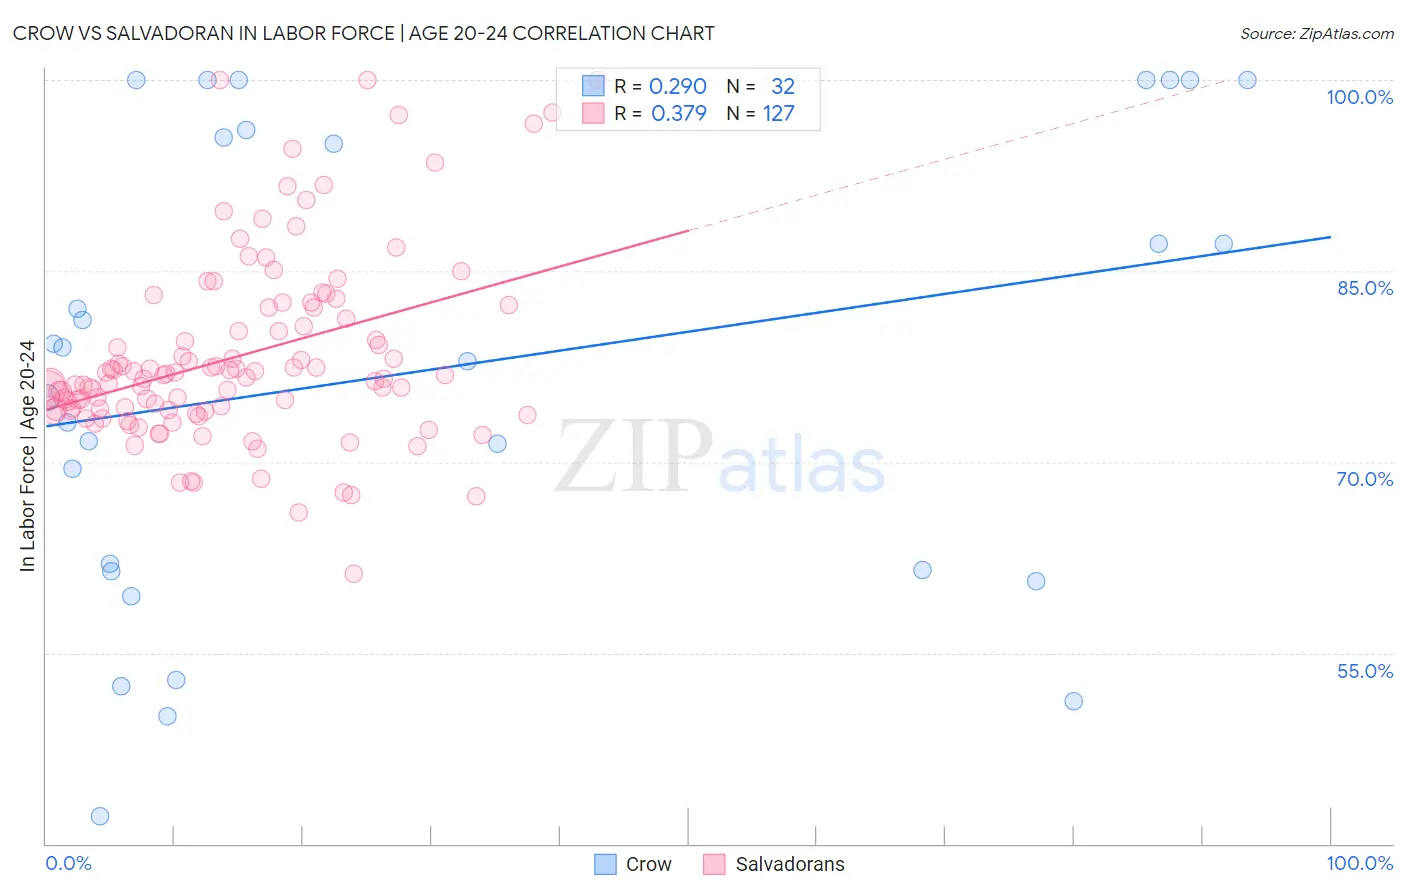
Crow vs Salvadoran In Labor Force | Age 20-24 Correlation Chart

The statistical analysis conducted on geographies consisting of 59,196,600 people shows a weak positive correlation between the proportion of Crow and labor force participation rate among population between the ages 20 and 24 in the United States with a correlation coefficient (R) of 0.290 and weighted average of 76.9%. Similarly, the statistical analysis conducted on geographies consisting of 398,945,167 people shows a mild positive correlation between the proportion of Salvadorans and labor force participation rate among population between the ages 20 and 24 in the United States with a correlation coefficient (R) of 0.379 and weighted average of 75.3%, a difference of 2.0%.
Crow vs Salvadoran In Labor Force | Age 20-24

In Labor Force | Age 20-24 Correlation Summary

MeasurementCrowSalvadoran
Minimum42.2%61.2%
Maximum100.0%100.0%
Range57.8%38.8%
Mean77.3%78.3%
Median78.5%76.6%
Interquartile 25% (IQ1)61.5%74.1%
Interquartile 75% (IQ3)95.8%82.1%
Interquartile Range (IQR)34.3%8.0%
Standard Deviation (Sample)18.1%7.3%
Standard Deviation (Population)17.9%7.3%

Similar Demographics by In Labor Force | Age 20-24

Demographics Similar to Crow by In Labor Force | Age 20-24

In terms of in labor force | age 20-24, the demographic groups most similar to Crow are Icelander (76.9%, a difference of 0.020%), Slavic (76.9%, a difference of 0.020%), White/Caucasian (76.9%, a difference of 0.050%), French American Indian (76.8%, a difference of 0.060%), and Immigrants from Sudan (76.8%, a difference of 0.080%).
DemographicsRating | RankIn Labor Force | Age 20-24
Hawaiians
99.9
/100
|
#58
Exceptional
77.0%
Scotch-Irish
99.9
/100
|
#59
Exceptional
77.0%
Kenyans
99.9
/100
|
#60
Exceptional
77.0%
Immigrants | Eritrea
99.9
/100
|
#61
Exceptional
77.0%
Immigrants | Kenya
99.9
/100
|
#62
Exceptional
77.0%
Lithuanians
99.9
/100
|
#63
Exceptional
77.0%
Whites/Caucasians
99.9
/100
|
#64
Exceptional
76.9%
Crow
99.9
/100
|
#65
Exceptional
76.9%
Icelanders
99.9
/100
|
#66
Exceptional
76.9%
Slavs
99.9
/100
|
#67
Exceptional
76.9%
French American Indians
99.8
/100
|
#68
Exceptional
76.8%
Immigrants | Sudan
99.8
/100
|
#69
Exceptional
76.8%
Ottawa
99.8
/100
|
#70
Exceptional
76.8%
Northern Europeans
99.8
/100
|
#71
Exceptional
76.8%
Guamanians/Chamorros
99.8
/100
|
#72
Exceptional
76.7%

Demographics Similar to Salvadorans by In Labor Force | Age 20-24

In terms of in labor force | age 20-24, the demographic groups most similar to Salvadorans are Paiute (75.3%, a difference of 0.010%), Ugandan (75.4%, a difference of 0.020%), Lebanese (75.3%, a difference of 0.030%), Immigrants from Cambodia (75.4%, a difference of 0.040%), and Comanche (75.4%, a difference of 0.050%).
DemographicsRating | RankIn Labor Force | Age 20-24
Spaniards
82.0
/100
|
#143
Excellent
75.5%
Bhutanese
80.8
/100
|
#144
Excellent
75.4%
Koreans
79.7
/100
|
#145
Good
75.4%
Mexican American Indians
78.8
/100
|
#146
Good
75.4%
Comanche
77.6
/100
|
#147
Good
75.4%
Immigrants | Cambodia
76.7
/100
|
#148
Good
75.4%
Ugandans
76.1
/100
|
#149
Good
75.4%
Salvadorans
74.8
/100
|
#150
Good
75.3%
Paiute
74.1
/100
|
#151
Good
75.3%
Lebanese
73.5
/100
|
#152
Good
75.3%
Guatemalans
72.3
/100
|
#153
Good
75.3%
Osage
72.3
/100
|
#154
Good
75.3%
Immigrants | Guatemala
71.9
/100
|
#155
Good
75.3%
Immigrants | El Salvador
71.7
/100
|
#156
Good
75.3%
Immigrants | Western Europe
71.5
/100
|
#157
Good
75.3%