Immigrants from Czechoslovakia vs Immigrants from South Africa In Labor Force | Age 20-64

COMPARE

Immigrants from Czechoslovakia
Race
Ancestry
AfghanAfricanAlaska NativeAlaskan AthabascanAlbanianAleutAlsatianAmericanApacheArabArapahoArgentineanArmenianAssyrian/Chaldean/SyriacAustralianAustrianBahamianBangladeshiBarbadianBasqueBelgianBelizeanBermudanBhutaneseBlackfeetBolivianBrazilianBritishBritish West IndianBulgarianBurmeseCajunCambodianCanadianCape VerdeanCarpatho RusynCelticCentral AmericanCentral American IndianCherokeeCheyenneChickasawChileanChineseChippewaChoctawColombianColvilleComancheCosta RicanCreeCreekCroatianCrowCubanCypriotCzechCzechoslovakianDanishDelawareDominicanDutchDutch West IndianEastern EuropeanEcuadorianEgyptianEnglishEstonianEthiopianEuropeanFijianFilipinoFinnishFrenchFrench American IndianFrench CanadianGermanGerman RussianGhanaianGreekGuamanian/ChamorroGuatemalanGuyaneseHaitianHmongHonduranHopiHoumaHungarianIcelanderIndian (Asian)IndonesianInupiatIranianIraqiIrishIroquoisIsraeliItalianJamaicanJapaneseJordanianKenyanKiowaKoreanLaotianLatvianLebaneseLiberianLithuanianLumbeeLuxembourgerMacedonianMalaysianMalteseMarshalleseMenomineeMexicanMexican American IndianMongolianMoroccanNative HawaiianNavajoNepaleseNew ZealanderNicaraguanNigerianNorthern EuropeanNorwegianOkinawanOsageOttawaPaiutePakistaniPalestinianPanamanianParaguayanPennsylvania GermanPeruvianPimaPolishPortuguesePotawatomiPuebloPuerto RicanPuget Sound SalishRomanianRussianSalvadoranSamoanScandinavianScotch-IrishScottishSeminoleSenegaleseSerbianShoshoneSierra LeoneanSiouxSlavicSlovakSloveneSomaliSouth AfricanSouth AmericanSouth American IndianSoviet UnionSpaniardSpanishSpanish AmericanSpanish American IndianSri LankanSubsaharan AfricanSudaneseSwedishSwissSyrianTaiwaneseThaiTlingit-HaidaTohono O'OdhamTonganTrinidadian and TobagonianTsimshianTurkishU.S. Virgin IslanderUgandanUkrainianUruguayanUteVenezuelanVietnameseWelshWest IndianYakamaYaquiYugoslavianYumanYup'ikZimbabwean
Immigration
NonimmigrantsImmigrantsAfghanistanAfricaAlbaniaArgentinaArmeniaAsiaAustraliaAustriaBahamasBangladeshBarbadosBelarusBelgiumBelizeBoliviaBosnia and HerzegovinaBrazilBulgariaBurma/MyanmarCabo VerdeCambodiaCameroonCanadaCaribbeanCentral AmericaChileChinaColombiaCongoCosta RicaCroatiaCubaCzechoslovakiaDenmarkDominicaDominican RepublicEastern AfricaEastern AsiaEastern EuropeEcuadorEgyptEl SalvadorEnglandEritreaEthiopiaEuropeFijiFranceGermanyGhanaGreeceGrenadaGuatemalaGuyanaHaitiHondurasHong KongHungaryIndiaIndonesiaIranIraqIrelandIsraelItalyJamaicaJapanJordanKazakhstanKenyaKoreaKuwaitLaosLatin AmericaLatviaLebanonLiberiaLithuaniaMalaysiaMexicoMicronesiaMiddle AfricaMoldovaMoroccoNepalNetherlandsNicaraguaNigeriaNorth AmericaNorth MacedoniaNorthern AfricaNorthern EuropeNorwayOceaniaPakistanPanamaPeruPhilippinesPolandPortugalRomaniaRussiaSaudi ArabiaScotlandSenegalSerbiaSierra LeoneSingaporeSomaliaSouth AmericaSouth Central AsiaSouth Eastern AsiaSouthern EuropeSpainSri LankaSt. Vincent and the GrenadinesSudanSwedenSwitzerlandSyriaTaiwanThailandTrinidad and TobagoTurkeyUgandaUkraineUruguayUzbekistanVenezuelaVietnamWest IndiesWestern AfricaWestern AsiaWestern EuropeYemenZaireZimbabweAzores
Immigrants from South Africa
Race
Ancestry
AfghanAfricanAlaska NativeAlaskan AthabascanAlbanianAleutAlsatianAmericanApacheArabArapahoArgentineanArmenianAssyrian/Chaldean/SyriacAustralianAustrianBahamianBangladeshiBarbadianBasqueBelgianBelizeanBermudanBhutaneseBlackfeetBolivianBrazilianBritishBritish West IndianBulgarianBurmeseCajunCambodianCanadianCape VerdeanCarpatho RusynCelticCentral AmericanCentral American IndianCherokeeCheyenneChickasawChileanChineseChippewaChoctawColombianColvilleComancheCosta RicanCreeCreekCroatianCrowCubanCypriotCzechCzechoslovakianDanishDelawareDominicanDutchDutch West IndianEastern EuropeanEcuadorianEgyptianEnglishEstonianEthiopianEuropeanFijianFilipinoFinnishFrenchFrench American IndianFrench CanadianGermanGerman RussianGhanaianGreekGuamanian/ChamorroGuatemalanGuyaneseHaitianHmongHonduranHopiHoumaHungarianIcelanderIndian (Asian)IndonesianInupiatIranianIraqiIrishIroquoisIsraeliItalianJamaicanJapaneseJordanianKenyanKiowaKoreanLaotianLatvianLebaneseLiberianLithuanianLumbeeLuxembourgerMacedonianMalaysianMalteseMarshalleseMenomineeMexicanMexican American IndianMongolianMoroccanNative HawaiianNavajoNepaleseNew ZealanderNicaraguanNigerianNorthern EuropeanNorwegianOkinawanOsageOttawaPaiutePakistaniPalestinianPanamanianParaguayanPennsylvania GermanPeruvianPimaPolishPortuguesePotawatomiPuebloPuerto RicanPuget Sound SalishRomanianRussianSalvadoranSamoanScandinavianScotch-IrishScottishSeminoleSenegaleseSerbianShoshoneSierra LeoneanSiouxSlavicSlovakSloveneSomaliSouth AfricanSouth AmericanSouth American IndianSoviet UnionSpaniardSpanishSpanish AmericanSpanish American IndianSri LankanSubsaharan AfricanSudaneseSwedishSwissSyrianTaiwaneseThaiTlingit-HaidaTohono O'OdhamTonganTrinidadian and TobagonianTsimshianTurkishU.S. Virgin IslanderUgandanUkrainianUruguayanUteVenezuelanVietnameseWelshWest IndianYakamaYaquiYugoslavianYumanYup'ikZimbabwean
Immigration
NonimmigrantsImmigrantsAfghanistanAfricaAlbaniaArgentinaArmeniaAsiaAustraliaAustriaBahamasBangladeshBarbadosBelarusBelgiumBelizeBoliviaBosnia and HerzegovinaBrazilBulgariaBurma/MyanmarCabo VerdeCambodiaCameroonCanadaCaribbeanCentral AmericaChileChinaColombiaCongoCosta RicaCroatiaCubaDenmarkDominicaDominican RepublicEastern AfricaEastern AsiaEastern EuropeEcuadorEgyptEl SalvadorEnglandEritreaEthiopiaEuropeFijiFranceGermanyGhanaGreeceGrenadaGuatemalaGuyanaHaitiHondurasHong KongHungaryIndiaIndonesiaIranIraqIrelandIsraelItalyJamaicaJapanJordanKazakhstanKenyaKoreaKuwaitLaosLatin AmericaLatviaLebanonLiberiaLithuaniaMalaysiaMexicoMicronesiaMiddle AfricaMoldovaMoroccoNepalNetherlandsNicaraguaNigeriaNorth AmericaNorth MacedoniaNorthern AfricaNorthern EuropeNorwayOceaniaPakistanPanamaPeruPhilippinesPolandPortugalRomaniaRussiaSaudi ArabiaScotlandSenegalSerbiaSierra LeoneSingaporeSomaliaSouth AfricaSouth AmericaSouth Central AsiaSouth Eastern AsiaSouthern EuropeSpainSri LankaSt. Vincent and the GrenadinesSudanSwedenSwitzerlandSyriaTaiwanThailandTrinidad and TobagoTurkeyUgandaUkraineUruguayUzbekistanVenezuelaVietnamWest IndiesWestern AfricaWestern AsiaWestern EuropeYemenZaireZimbabweAzores
In Labor Force | Age 20-64
Income
Poverty
Unemployment
Labor Participation
Family Structure
Vehicle Availability
Education Level
Disability

In Labor Force | Age 20-64 Comparison

Immigrants from Czechoslovakia

Immigrants from South Africa

Excellent
Good
79.9%
IN LABOR FORCE | AGE 20-64
89.7/ 100
METRIC RATING
127th/ 347
METRIC RANK
79.7%
IN LABOR FORCE | AGE 20-64
69.2/ 100
METRIC RATING
155th/ 347
METRIC RANK

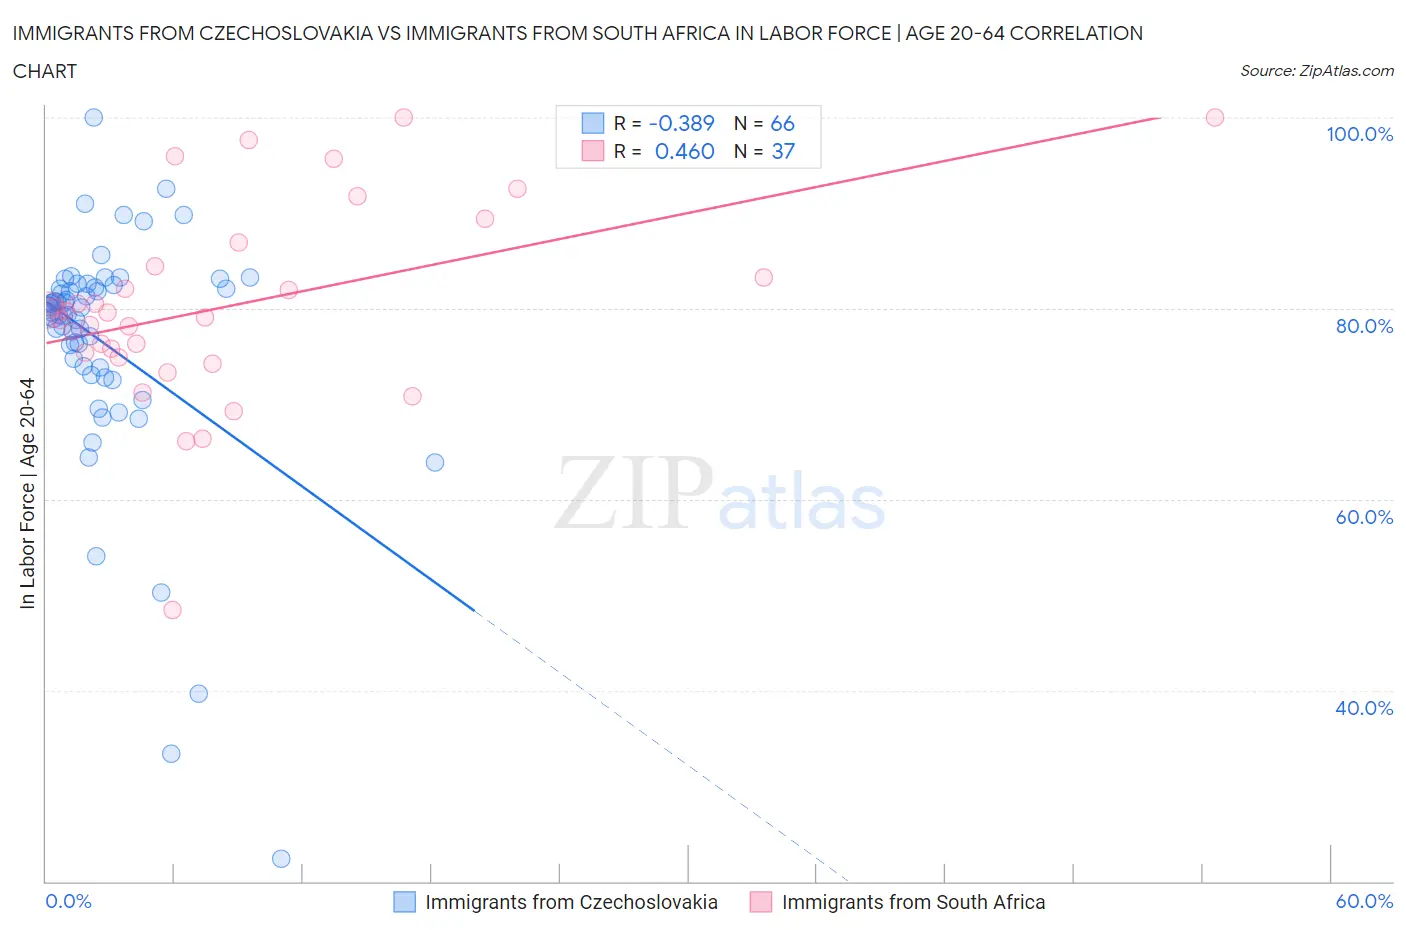
Immigrants from Czechoslovakia vs Immigrants from South Africa In Labor Force | Age 20-64 Correlation Chart

The statistical analysis conducted on geographies consisting of 195,457,466 people shows a mild negative correlation between the proportion of Immigrants from Czechoslovakia and labor force participation rate among population between the ages 20 and 64 in the United States with a correlation coefficient (R) of -0.389 and weighted average of 79.9%. Similarly, the statistical analysis conducted on geographies consisting of 233,321,887 people shows a moderate positive correlation between the proportion of Immigrants from South Africa and labor force participation rate among population between the ages 20 and 64 in the United States with a correlation coefficient (R) of 0.460 and weighted average of 79.7%, a difference of 0.27%.
Immigrants from Czechoslovakia vs Immigrants from South Africa In Labor Force | Age 20-64

In Labor Force | Age 20-64 Correlation Summary

MeasurementImmigrants from CzechoslovakiaImmigrants from South Africa
Minimum22.4%48.4%
Maximum100.0%100.0%
Range77.6%51.6%
Mean76.3%80.3%
Median79.7%79.6%
Interquartile 25% (IQ1)73.8%75.1%
Interquartile 75% (IQ3)82.3%85.6%
Interquartile Range (IQR)8.5%10.5%
Standard Deviation (Sample)12.7%10.4%
Standard Deviation (Population)12.6%10.3%

Similar Demographics by In Labor Force | Age 20-64

Demographics Similar to Immigrants from Czechoslovakia by In Labor Force | Age 20-64

In terms of in labor force | age 20-64, the demographic groups most similar to Immigrants from Czechoslovakia are Immigrants from Eastern Asia (79.9%, a difference of 0.010%), Immigrants from France (79.9%, a difference of 0.020%), Italian (79.9%, a difference of 0.020%), Immigrants from Zaire (79.9%, a difference of 0.020%), and Immigrants from Iran (79.9%, a difference of 0.030%).
DemographicsRating | RankIn Labor Force | Age 20-64
Maltese
92.4
/100
|
#120
Exceptional
80.0%
Immigrants | Kuwait
92.2
/100
|
#121
Exceptional
80.0%
Mongolians
92.0
/100
|
#122
Exceptional
79.9%
Immigrants | Russia
91.8
/100
|
#123
Exceptional
79.9%
Immigrants | Europe
91.6
/100
|
#124
Exceptional
79.9%
Danes
91.5
/100
|
#125
Exceptional
79.9%
Immigrants | France
90.7
/100
|
#126
Exceptional
79.9%
Immigrants | Czechoslovakia
89.7
/100
|
#127
Excellent
79.9%
Immigrants | Eastern Asia
89.4
/100
|
#128
Excellent
79.9%
Italians
88.9
/100
|
#129
Excellent
79.9%
Immigrants | Zaire
88.6
/100
|
#130
Excellent
79.9%
Immigrants | Iran
88.3
/100
|
#131
Excellent
79.9%
Indians (Asian)
87.7
/100
|
#132
Excellent
79.9%
South American Indians
87.6
/100
|
#133
Excellent
79.9%
Belgians
87.4
/100
|
#134
Excellent
79.9%

Demographics Similar to Immigrants from South Africa by In Labor Force | Age 20-64

In terms of in labor force | age 20-64, the demographic groups most similar to Immigrants from South Africa are Immigrants from Kazakhstan (79.7%, a difference of 0.0%), New Zealander (79.7%, a difference of 0.0%), Senegalese (79.7%, a difference of 0.0%), Immigrants from China (79.7%, a difference of 0.0%), and Austrian (79.7%, a difference of 0.010%).
DemographicsRating | RankIn Labor Force | Age 20-64
Romanians
77.6
/100
|
#148
Good
79.8%
Icelanders
75.1
/100
|
#149
Good
79.7%
Costa Ricans
72.4
/100
|
#150
Good
79.7%
Scandinavians
72.0
/100
|
#151
Good
79.7%
Immigrants | Northern Europe
72.0
/100
|
#152
Good
79.7%
Immigrants | Kazakhstan
69.5
/100
|
#153
Good
79.7%
New Zealanders
69.4
/100
|
#154
Good
79.7%
Immigrants | South Africa
69.2
/100
|
#155
Good
79.7%
Senegalese
69.1
/100
|
#156
Good
79.7%
Immigrants | China
69.1
/100
|
#157
Good
79.7%
Austrians
67.6
/100
|
#158
Good
79.7%
Immigrants | Cuba
66.7
/100
|
#159
Good
79.7%
Moroccans
66.7
/100
|
#160
Good
79.7%
South Africans
66.2
/100
|
#161
Good
79.7%
Germans
65.2
/100
|
#162
Good
79.7%