Immigrants from Czechoslovakia vs Belgian In Labor Force | Age 35-44

COMPARE

Immigrants from Czechoslovakia
Race
Ancestry
AfghanAfricanAlaska NativeAlaskan AthabascanAlbanianAleutAlsatianAmericanApacheArabArapahoArgentineanArmenianAssyrian/Chaldean/SyriacAustralianAustrianBahamianBangladeshiBarbadianBasqueBelizeanBermudanBhutaneseBlackfeetBolivianBrazilianBritishBritish West IndianBulgarianBurmeseCajunCambodianCanadianCape VerdeanCarpatho RusynCelticCentral AmericanCentral American IndianCherokeeCheyenneChickasawChileanChineseChippewaChoctawColombianColvilleComancheCosta RicanCreeCreekCroatianCrowCubanCypriotCzechCzechoslovakianDanishDelawareDominicanDutchDutch West IndianEastern EuropeanEcuadorianEgyptianEnglishEstonianEthiopianEuropeanFijianFilipinoFinnishFrenchFrench American IndianFrench CanadianGermanGerman RussianGhanaianGreekGuamanian/ChamorroGuatemalanGuyaneseHaitianHmongHonduranHopiHoumaHungarianIcelanderIndian (Asian)IndonesianInupiatIranianIraqiIrishIroquoisIsraeliItalianJamaicanJapaneseJordanianKenyanKiowaKoreanLaotianLatvianLebaneseLiberianLithuanianLumbeeLuxembourgerMacedonianMalaysianMalteseMarshalleseMenomineeMexicanMexican American IndianMongolianMoroccanNative HawaiianNavajoNepaleseNew ZealanderNicaraguanNigerianNorthern EuropeanNorwegianOkinawanOsageOttawaPaiutePakistaniPalestinianPanamanianParaguayanPennsylvania GermanPeruvianPimaPolishPortuguesePotawatomiPuebloPuerto RicanPuget Sound SalishRomanianRussianSalvadoranSamoanScandinavianScotch-IrishScottishSeminoleSenegaleseSerbianShoshoneSierra LeoneanSiouxSlavicSlovakSloveneSomaliSouth AfricanSouth AmericanSouth American IndianSoviet UnionSpaniardSpanishSpanish AmericanSpanish American IndianSri LankanSubsaharan AfricanSudaneseSwedishSwissSyrianTaiwaneseThaiTlingit-HaidaTohono O'OdhamTonganTrinidadian and TobagonianTsimshianTurkishU.S. Virgin IslanderUgandanUkrainianUruguayanUteVenezuelanVietnameseWelshWest IndianYakamaYaquiYugoslavianYumanYup'ikZimbabwean
Immigration
NonimmigrantsImmigrantsAfghanistanAfricaAlbaniaArgentinaArmeniaAsiaAustraliaAustriaBahamasBangladeshBarbadosBelarusBelgiumBelizeBoliviaBosnia and HerzegovinaBrazilBulgariaBurma/MyanmarCabo VerdeCambodiaCameroonCanadaCaribbeanCentral AmericaChileChinaColombiaCongoCosta RicaCroatiaCubaCzechoslovakiaDenmarkDominicaDominican RepublicEastern AfricaEastern AsiaEastern EuropeEcuadorEgyptEl SalvadorEnglandEritreaEthiopiaEuropeFijiFranceGermanyGhanaGreeceGrenadaGuatemalaGuyanaHaitiHondurasHong KongHungaryIndiaIndonesiaIranIraqIrelandIsraelItalyJamaicaJapanJordanKazakhstanKenyaKoreaKuwaitLaosLatin AmericaLatviaLebanonLiberiaLithuaniaMalaysiaMexicoMicronesiaMiddle AfricaMoldovaMoroccoNepalNetherlandsNicaraguaNigeriaNorth AmericaNorth MacedoniaNorthern AfricaNorthern EuropeNorwayOceaniaPakistanPanamaPeruPhilippinesPolandPortugalRomaniaRussiaSaudi ArabiaScotlandSenegalSerbiaSierra LeoneSingaporeSomaliaSouth AfricaSouth AmericaSouth Central AsiaSouth Eastern AsiaSouthern EuropeSpainSri LankaSt. Vincent and the GrenadinesSudanSwedenSwitzerlandSyriaTaiwanThailandTrinidad and TobagoTurkeyUgandaUkraineUruguayUzbekistanVenezuelaVietnamWest IndiesWestern AfricaWestern AsiaWestern EuropeYemenZaireZimbabweAzores
Belgian
Race
Ancestry
AfghanAfricanAlaska NativeAlaskan AthabascanAlbanianAleutAlsatianAmericanApacheArabArapahoArgentineanArmenianAssyrian/Chaldean/SyriacAustralianAustrianBahamianBangladeshiBarbadianBasqueBelgianBelizeanBermudanBhutaneseBlackfeetBolivianBrazilianBritishBritish West IndianBulgarianBurmeseCajunCambodianCanadianCape VerdeanCarpatho RusynCelticCentral AmericanCentral American IndianCherokeeCheyenneChickasawChileanChineseChippewaChoctawColombianColvilleComancheCosta RicanCreeCreekCroatianCrowCubanCypriotCzechCzechoslovakianDanishDelawareDominicanDutchDutch West IndianEastern EuropeanEcuadorianEgyptianEnglishEstonianEthiopianEuropeanFijianFilipinoFinnishFrenchFrench American IndianFrench CanadianGermanGerman RussianGhanaianGreekGuamanian/ChamorroGuatemalanGuyaneseHaitianHmongHonduranHopiHoumaHungarianIcelanderIndian (Asian)IndonesianInupiatIranianIraqiIrishIroquoisIsraeliItalianJamaicanJapaneseJordanianKenyanKiowaKoreanLaotianLatvianLebaneseLiberianLithuanianLumbeeLuxembourgerMacedonianMalaysianMalteseMarshalleseMenomineeMexicanMexican American IndianMongolianMoroccanNative HawaiianNavajoNepaleseNew ZealanderNicaraguanNigerianNorthern EuropeanNorwegianOkinawanOsageOttawaPaiutePakistaniPalestinianPanamanianParaguayanPennsylvania GermanPeruvianPimaPolishPortuguesePotawatomiPuebloPuerto RicanPuget Sound SalishRomanianRussianSalvadoranSamoanScandinavianScotch-IrishScottishSeminoleSenegaleseSerbianShoshoneSierra LeoneanSiouxSlavicSlovakSloveneSomaliSouth AfricanSouth AmericanSouth American IndianSoviet UnionSpaniardSpanishSpanish AmericanSpanish American IndianSri LankanSubsaharan AfricanSudaneseSwedishSwissSyrianTaiwaneseThaiTlingit-HaidaTohono O'OdhamTonganTrinidadian and TobagonianTsimshianTurkishU.S. Virgin IslanderUgandanUkrainianUruguayanUteVenezuelanVietnameseWelshWest IndianYakamaYaquiYugoslavianYumanYup'ikZimbabwean
Immigration
NonimmigrantsImmigrantsAfghanistanAfricaAlbaniaArgentinaArmeniaAsiaAustraliaAustriaBahamasBangladeshBarbadosBelarusBelgiumBelizeBoliviaBosnia and HerzegovinaBrazilBulgariaBurma/MyanmarCabo VerdeCambodiaCameroonCanadaCaribbeanCentral AmericaChileChinaColombiaCongoCosta RicaCroatiaCubaDenmarkDominicaDominican RepublicEastern AfricaEastern AsiaEastern EuropeEcuadorEgyptEl SalvadorEnglandEritreaEthiopiaEuropeFijiFranceGermanyGhanaGreeceGrenadaGuatemalaGuyanaHaitiHondurasHong KongHungaryIndiaIndonesiaIranIraqIrelandIsraelItalyJamaicaJapanJordanKazakhstanKenyaKoreaKuwaitLaosLatin AmericaLatviaLebanonLiberiaLithuaniaMalaysiaMexicoMicronesiaMiddle AfricaMoldovaMoroccoNepalNetherlandsNicaraguaNigeriaNorth AmericaNorth MacedoniaNorthern AfricaNorthern EuropeNorwayOceaniaPakistanPanamaPeruPhilippinesPolandPortugalRomaniaRussiaSaudi ArabiaScotlandSenegalSerbiaSierra LeoneSingaporeSomaliaSouth AfricaSouth AmericaSouth Central AsiaSouth Eastern AsiaSouthern EuropeSpainSri LankaSt. Vincent and the GrenadinesSudanSwedenSwitzerlandSyriaTaiwanThailandTrinidad and TobagoTurkeyUgandaUkraineUruguayUzbekistanVenezuelaVietnamWest IndiesWestern AfricaWestern AsiaWestern EuropeYemenZaireZimbabweAzores
In Labor Force | Age 35-44
Income
Poverty
Unemployment
Labor Participation
Family Structure
Vehicle Availability
Education Level
Disability

In Labor Force | Age 35-44 Comparison

Immigrants from Czechoslovakia

Belgians

Exceptional
Exceptional
84.8%
IN LABOR FORCE | AGE 35-44
95.9/ 100
METRIC RATING
100th/ 347
METRIC RANK
84.9%
IN LABOR FORCE | AGE 35-44
97.7/ 100
METRIC RATING
87th/ 347
METRIC RANK

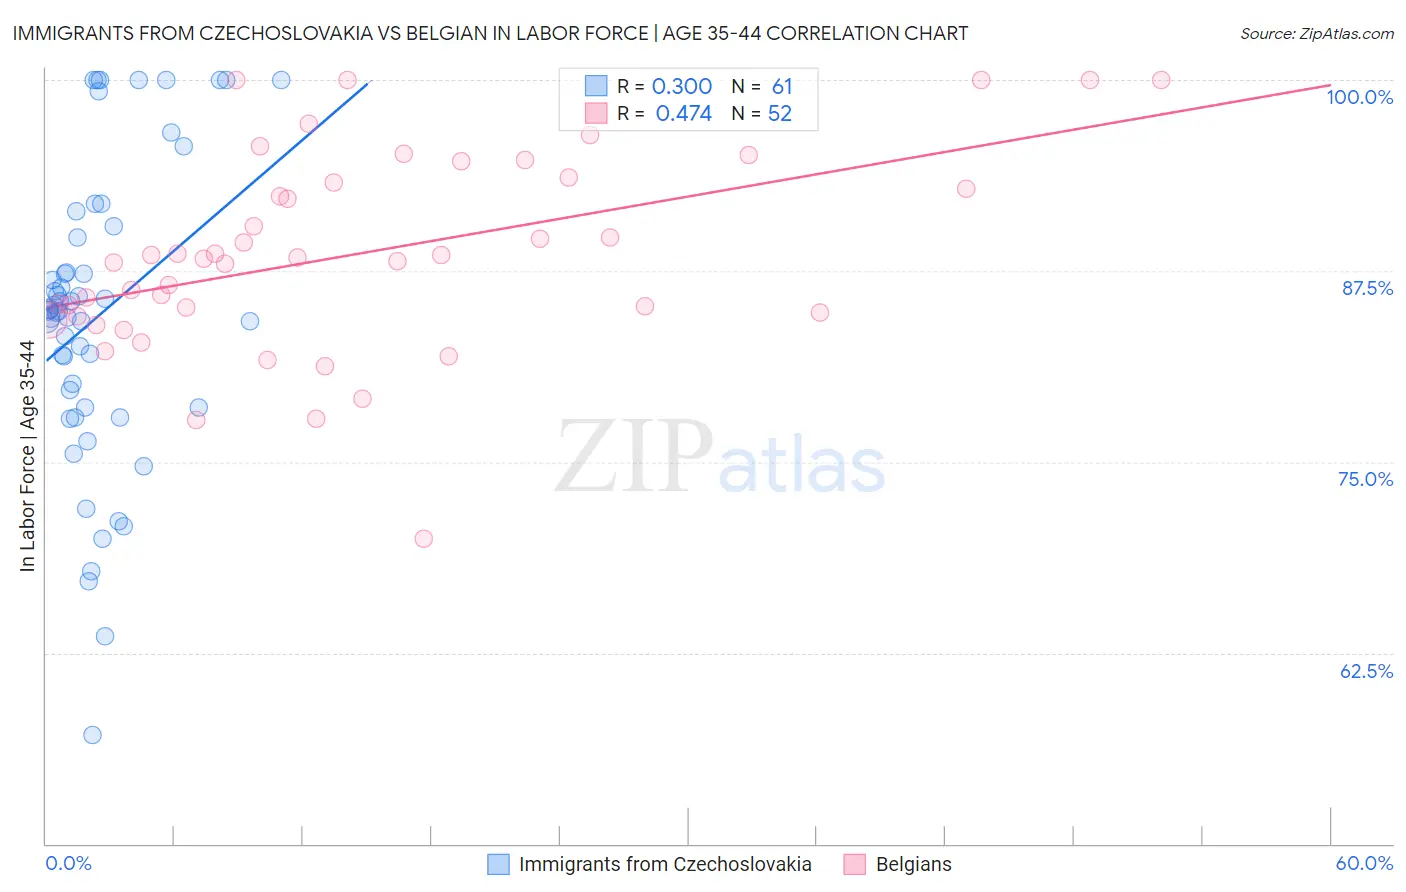
Immigrants from Czechoslovakia vs Belgian In Labor Force | Age 35-44 Correlation Chart

The statistical analysis conducted on geographies consisting of 195,439,739 people shows a mild positive correlation between the proportion of Immigrants from Czechoslovakia and labor force participation rate among population between the ages 35 and 44 in the United States with a correlation coefficient (R) of 0.300 and weighted average of 84.8%. Similarly, the statistical analysis conducted on geographies consisting of 355,899,955 people shows a moderate positive correlation between the proportion of Belgians and labor force participation rate among population between the ages 35 and 44 in the United States with a correlation coefficient (R) of 0.474 and weighted average of 84.9%, a difference of 0.10%.
Immigrants from Czechoslovakia vs Belgian In Labor Force | Age 35-44

In Labor Force | Age 35-44 Correlation Summary

MeasurementImmigrants from CzechoslovakiaBelgian
Minimum57.1%70.0%
Maximum100.0%100.0%
Range42.9%30.0%
Mean84.5%88.6%
Median84.9%88.3%
Interquartile 25% (IQ1)78.6%84.7%
Interquartile 75% (IQ3)90.1%93.4%
Interquartile Range (IQR)11.5%8.8%
Standard Deviation (Sample)9.7%6.5%
Standard Deviation (Population)9.7%6.4%

Demographics Similar to Immigrants from Czechoslovakia and Belgians by In Labor Force | Age 35-44

In terms of in labor force | age 35-44, the demographic groups most similar to Immigrants from Czechoslovakia are Haitian (84.8%, a difference of 0.0%), Indian (Asian) (84.8%, a difference of 0.010%), Immigrants from Australia (84.8%, a difference of 0.010%), Immigrants from Southern Europe (84.8%, a difference of 0.020%), and Immigrants from Belarus (84.8%, a difference of 0.020%). Similarly, the demographic groups most similar to Belgians are Greek (84.9%, a difference of 0.0%), Yugoslavian (84.9%, a difference of 0.0%), Senegalese (84.9%, a difference of 0.010%), Immigrants from Peru (84.9%, a difference of 0.010%), and Immigrants from Middle Africa (84.9%, a difference of 0.010%).
DemographicsRating | RankIn Labor Force | Age 35-44
Senegalese
97.8
/100
|
#83
Exceptional
84.9%
Immigrants | Peru
97.8
/100
|
#84
Exceptional
84.9%
Immigrants | Middle Africa
97.8
/100
|
#85
Exceptional
84.9%
Greeks
97.8
/100
|
#86
Exceptional
84.9%
Belgians
97.7
/100
|
#87
Exceptional
84.9%
Yugoslavians
97.7
/100
|
#88
Exceptional
84.9%
Immigrants | Pakistan
97.5
/100
|
#89
Exceptional
84.9%
Immigrants | France
97.4
/100
|
#90
Exceptional
84.9%
Immigrants | Europe
97.2
/100
|
#91
Exceptional
84.9%
Ghanaians
97.2
/100
|
#92
Exceptional
84.8%
Immigrants | Northern Africa
97.1
/100
|
#93
Exceptional
84.8%
Mongolians
96.8
/100
|
#94
Exceptional
84.8%
Immigrants | Kuwait
96.7
/100
|
#95
Exceptional
84.8%
Cubans
96.6
/100
|
#96
Exceptional
84.8%
Egyptians
96.6
/100
|
#97
Exceptional
84.8%
Indians (Asian)
96.1
/100
|
#98
Exceptional
84.8%
Haitians
96.0
/100
|
#99
Exceptional
84.8%
Immigrants | Czechoslovakia
95.9
/100
|
#100
Exceptional
84.8%
Immigrants | Australia
95.5
/100
|
#101
Exceptional
84.8%
Immigrants | Southern Europe
95.3
/100
|
#102
Exceptional
84.8%
Immigrants | Belarus
95.3
/100
|
#103
Exceptional
84.8%