Immigrants from Bulgaria vs Iroquois In Labor Force | Age 30-34
COMPARE
Immigrants from Bulgaria
Iroquois
In Labor Force | Age 30-34
In Labor Force | Age 30-34 Comparison
Immigrants from Bulgaria
Iroquois
86.0%
IN LABOR FORCE | AGE 30-34
100.0/ 100
METRIC RATING
21st/ 347
METRIC RANK
81.9%
IN LABOR FORCE | AGE 30-34
0.0/ 100
METRIC RATING
313th/ 347
METRIC RANK
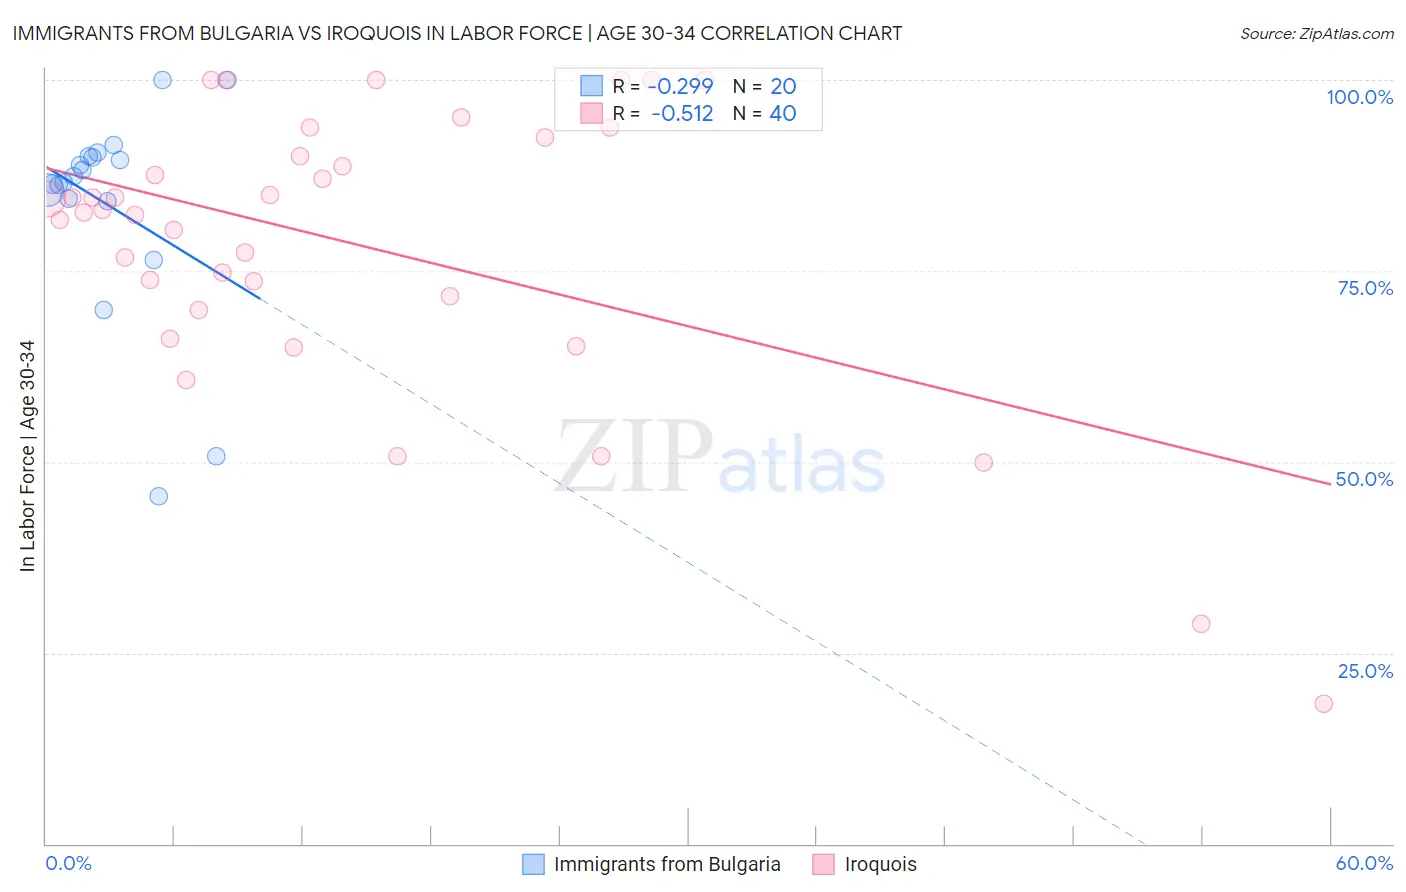
Immigrants from Bulgaria vs Iroquois In Labor Force | Age 30-34 Correlation Chart
The statistical analysis conducted on geographies consisting of 172,547,682 people shows a weak negative correlation between the proportion of Immigrants from Bulgaria and labor force participation rate among population between the ages 30 and 34 in the United States with a correlation coefficient (R) of -0.299 and weighted average of 86.0%. Similarly, the statistical analysis conducted on geographies consisting of 207,240,076 people shows a substantial negative correlation between the proportion of Iroquois and labor force participation rate among population between the ages 30 and 34 in the United States with a correlation coefficient (R) of -0.512 and weighted average of 81.9%, a difference of 5.0%.
In Labor Force | Age 30-34 Correlation Summary
| Measurement | Immigrants from Bulgaria | Iroquois |
| Minimum | 45.5% | 18.3% |
| Maximum | 100.0% | 100.0% |
| Range | 54.5% | 81.7% |
| Mean | 83.6% | 78.4% |
| Median | 87.0% | 82.8% |
| Interquartile 25% (IQ1) | 84.3% | 70.7% |
| Interquartile 75% (IQ3) | 90.0% | 91.2% |
| Interquartile Range (IQR) | 5.7% | 20.5% |
| Standard Deviation (Sample) | 13.8% | 18.8% |
| Standard Deviation (Population) | 13.5% | 18.6% |
Similar Demographics by In Labor Force | Age 30-34
Demographics Similar to Immigrants from Bulgaria by In Labor Force | Age 30-34
In terms of in labor force | age 30-34, the demographic groups most similar to Immigrants from Bulgaria are Bulgarian (86.0%, a difference of 0.0%), Sierra Leonean (86.0%, a difference of 0.010%), Bermudan (85.9%, a difference of 0.020%), Estonian (85.9%, a difference of 0.030%), and Immigrants from Eritrea (85.9%, a difference of 0.040%).
| Demographics | Rating | Rank | In Labor Force | Age 30-34 |
| Immigrants | Cabo Verde | 100.0 /100 | #14 | Exceptional 86.1% |
| Immigrants | Albania | 100.0 /100 | #15 | Exceptional 86.1% |
| Latvians | 100.0 /100 | #16 | Exceptional 86.0% |
| Immigrants | Cameroon | 100.0 /100 | #17 | Exceptional 86.0% |
| Immigrants | Sierra Leone | 100.0 /100 | #18 | Exceptional 86.0% |
| Sierra Leoneans | 100.0 /100 | #19 | Exceptional 86.0% |
| Bulgarians | 100.0 /100 | #20 | Exceptional 86.0% |
| Immigrants | Bulgaria | 100.0 /100 | #21 | Exceptional 86.0% |
| Bermudans | 100.0 /100 | #22 | Exceptional 85.9% |
| Estonians | 100.0 /100 | #23 | Exceptional 85.9% |
| Immigrants | Eritrea | 100.0 /100 | #24 | Exceptional 85.9% |
| Immigrants | North Macedonia | 100.0 /100 | #25 | Exceptional 85.9% |
| Immigrants | Eastern Africa | 100.0 /100 | #26 | Exceptional 85.9% |
| Immigrants | Liberia | 100.0 /100 | #27 | Exceptional 85.9% |
| Immigrants | Latvia | 100.0 /100 | #28 | Exceptional 85.9% |
Demographics Similar to Iroquois by In Labor Force | Age 30-34
In terms of in labor force | age 30-34, the demographic groups most similar to Iroquois are Chickasaw (81.9%, a difference of 0.020%), Mexican (81.9%, a difference of 0.020%), Cajun (82.0%, a difference of 0.070%), Immigrants from Mexico (82.0%, a difference of 0.10%), and Alaskan Athabascan (81.7%, a difference of 0.25%).
| Demographics | Rating | Rank | In Labor Force | Age 30-34 |
| Spanish American Indians | 0.0 /100 | #306 | Tragic 82.2% |
| Menominee | 0.0 /100 | #307 | Tragic 82.2% |
| Puget Sound Salish | 0.0 /100 | #308 | Tragic 82.1% |
| Immigrants | Mexico | 0.0 /100 | #309 | Tragic 82.0% |
| Cajuns | 0.0 /100 | #310 | Tragic 82.0% |
| Chickasaw | 0.0 /100 | #311 | Tragic 81.9% |
| Mexicans | 0.0 /100 | #312 | Tragic 81.9% |
| Iroquois | 0.0 /100 | #313 | Tragic 81.9% |
| Alaskan Athabascans | 0.0 /100 | #314 | Tragic 81.7% |
| Cherokee | 0.0 /100 | #315 | Tragic 81.6% |
| Immigrants | Azores | 0.0 /100 | #316 | Tragic 81.5% |
| Arapaho | 0.0 /100 | #317 | Tragic 81.5% |
| Choctaw | 0.0 /100 | #318 | Tragic 81.4% |
| Shoshone | 0.0 /100 | #319 | Tragic 81.4% |
| Yaqui | 0.0 /100 | #320 | Tragic 81.4% |