Immigrants from Armenia vs Immigrants from Eastern Europe In Labor Force | Age 20-64

COMPARE

Immigrants from Armenia
Race
Ancestry
AfghanAfricanAlaska NativeAlaskan AthabascanAlbanianAleutAlsatianAmericanApacheArabArapahoArgentineanArmenianAssyrian/Chaldean/SyriacAustralianAustrianBahamianBangladeshiBarbadianBasqueBelgianBelizeanBermudanBhutaneseBlackfeetBolivianBrazilianBritishBritish West IndianBulgarianBurmeseCajunCambodianCanadianCape VerdeanCarpatho RusynCelticCentral AmericanCentral American IndianCherokeeCheyenneChickasawChileanChineseChippewaChoctawColombianColvilleComancheCosta RicanCreeCreekCroatianCrowCubanCypriotCzechCzechoslovakianDanishDelawareDominicanDutchDutch West IndianEastern EuropeanEcuadorianEgyptianEnglishEstonianEthiopianEuropeanFijianFilipinoFinnishFrenchFrench American IndianFrench CanadianGermanGerman RussianGhanaianGreekGuamanian/ChamorroGuatemalanGuyaneseHaitianHmongHonduranHopiHoumaHungarianIcelanderIndian (Asian)IndonesianInupiatIranianIraqiIrishIroquoisIsraeliItalianJamaicanJapaneseJordanianKenyanKiowaKoreanLaotianLatvianLebaneseLiberianLithuanianLumbeeLuxembourgerMacedonianMalaysianMalteseMarshalleseMenomineeMexicanMexican American IndianMongolianMoroccanNative HawaiianNavajoNepaleseNew ZealanderNicaraguanNigerianNorthern EuropeanNorwegianOkinawanOsageOttawaPaiutePakistaniPalestinianPanamanianParaguayanPennsylvania GermanPeruvianPimaPolishPortuguesePotawatomiPuebloPuerto RicanPuget Sound SalishRomanianRussianSalvadoranSamoanScandinavianScotch-IrishScottishSeminoleSenegaleseSerbianShoshoneSierra LeoneanSiouxSlavicSlovakSloveneSomaliSouth AfricanSouth AmericanSouth American IndianSoviet UnionSpaniardSpanishSpanish AmericanSpanish American IndianSri LankanSubsaharan AfricanSudaneseSwedishSwissSyrianTaiwaneseThaiTlingit-HaidaTohono O'OdhamTonganTrinidadian and TobagonianTsimshianTurkishU.S. Virgin IslanderUgandanUkrainianUruguayanUteVenezuelanVietnameseWelshWest IndianYakamaYaquiYugoslavianYumanYup'ikZimbabwean
Immigration
NonimmigrantsImmigrantsAfghanistanAfricaAlbaniaArgentinaArmeniaAsiaAustraliaAustriaBahamasBangladeshBarbadosBelarusBelgiumBelizeBoliviaBosnia and HerzegovinaBrazilBulgariaBurma/MyanmarCabo VerdeCambodiaCameroonCanadaCaribbeanCentral AmericaChileChinaColombiaCongoCosta RicaCroatiaCubaCzechoslovakiaDenmarkDominicaDominican RepublicEastern AfricaEastern AsiaEcuadorEgyptEl SalvadorEnglandEritreaEthiopiaEuropeFijiFranceGermanyGhanaGreeceGrenadaGuatemalaGuyanaHaitiHondurasHong KongHungaryIndiaIndonesiaIranIraqIrelandIsraelItalyJamaicaJapanJordanKazakhstanKenyaKoreaKuwaitLaosLatin AmericaLatviaLebanonLiberiaLithuaniaMalaysiaMexicoMicronesiaMiddle AfricaMoldovaMoroccoNepalNetherlandsNicaraguaNigeriaNorth AmericaNorth MacedoniaNorthern AfricaNorthern EuropeNorwayOceaniaPakistanPanamaPeruPhilippinesPolandPortugalRomaniaRussiaSaudi ArabiaScotlandSenegalSerbiaSierra LeoneSingaporeSomaliaSouth AfricaSouth AmericaSouth Central AsiaSouth Eastern AsiaSouthern EuropeSpainSri LankaSt. Vincent and the GrenadinesSudanSwedenSwitzerlandSyriaTaiwanThailandTrinidad and TobagoTurkeyUgandaUkraineUruguayUzbekistanVenezuelaVietnamWest IndiesWestern AfricaWestern AsiaWestern EuropeYemenZaireZimbabweAzores
Immigrants from Eastern Europe
Race
Ancestry
AfghanAfricanAlaska NativeAlaskan AthabascanAlbanianAleutAlsatianAmericanApacheArabArapahoArgentineanArmenianAssyrian/Chaldean/SyriacAustralianAustrianBahamianBangladeshiBarbadianBasqueBelgianBelizeanBermudanBhutaneseBlackfeetBolivianBrazilianBritishBritish West IndianBulgarianBurmeseCajunCambodianCanadianCape VerdeanCarpatho RusynCelticCentral AmericanCentral American IndianCherokeeCheyenneChickasawChileanChineseChippewaChoctawColombianColvilleComancheCosta RicanCreeCreekCroatianCrowCubanCypriotCzechCzechoslovakianDanishDelawareDominicanDutchDutch West IndianEastern EuropeanEcuadorianEgyptianEnglishEstonianEthiopianEuropeanFijianFilipinoFinnishFrenchFrench American IndianFrench CanadianGermanGerman RussianGhanaianGreekGuamanian/ChamorroGuatemalanGuyaneseHaitianHmongHonduranHopiHoumaHungarianIcelanderIndian (Asian)IndonesianInupiatIranianIraqiIrishIroquoisIsraeliItalianJamaicanJapaneseJordanianKenyanKiowaKoreanLaotianLatvianLebaneseLiberianLithuanianLumbeeLuxembourgerMacedonianMalaysianMalteseMarshalleseMenomineeMexicanMexican American IndianMongolianMoroccanNative HawaiianNavajoNepaleseNew ZealanderNicaraguanNigerianNorthern EuropeanNorwegianOkinawanOsageOttawaPaiutePakistaniPalestinianPanamanianParaguayanPennsylvania GermanPeruvianPimaPolishPortuguesePotawatomiPuebloPuerto RicanPuget Sound SalishRomanianRussianSalvadoranSamoanScandinavianScotch-IrishScottishSeminoleSenegaleseSerbianShoshoneSierra LeoneanSiouxSlavicSlovakSloveneSomaliSouth AfricanSouth AmericanSouth American IndianSoviet UnionSpaniardSpanishSpanish AmericanSpanish American IndianSri LankanSubsaharan AfricanSudaneseSwedishSwissSyrianTaiwaneseThaiTlingit-HaidaTohono O'OdhamTonganTrinidadian and TobagonianTsimshianTurkishU.S. Virgin IslanderUgandanUkrainianUruguayanUteVenezuelanVietnameseWelshWest IndianYakamaYaquiYugoslavianYumanYup'ikZimbabwean
Immigration
NonimmigrantsImmigrantsAfghanistanAfricaAlbaniaArgentinaAsiaAustraliaAustriaBahamasBangladeshBarbadosBelarusBelgiumBelizeBoliviaBosnia and HerzegovinaBrazilBulgariaBurma/MyanmarCabo VerdeCambodiaCameroonCanadaCaribbeanCentral AmericaChileChinaColombiaCongoCosta RicaCroatiaCubaCzechoslovakiaDenmarkDominicaDominican RepublicEastern AfricaEastern AsiaEastern EuropeEcuadorEgyptEl SalvadorEnglandEritreaEthiopiaEuropeFijiFranceGermanyGhanaGreeceGrenadaGuatemalaGuyanaHaitiHondurasHong KongHungaryIndiaIndonesiaIranIraqIrelandIsraelItalyJamaicaJapanJordanKazakhstanKenyaKoreaKuwaitLaosLatin AmericaLatviaLebanonLiberiaLithuaniaMalaysiaMexicoMicronesiaMiddle AfricaMoldovaMoroccoNepalNetherlandsNicaraguaNigeriaNorth AmericaNorth MacedoniaNorthern AfricaNorthern EuropeNorwayOceaniaPakistanPanamaPeruPhilippinesPolandPortugalRomaniaRussiaSaudi ArabiaScotlandSenegalSerbiaSierra LeoneSingaporeSomaliaSouth AfricaSouth AmericaSouth Central AsiaSouth Eastern AsiaSouthern EuropeSpainSri LankaSt. Vincent and the GrenadinesSudanSwedenSwitzerlandSyriaTaiwanThailandTrinidad and TobagoTurkeyUgandaUkraineUruguayUzbekistanVenezuelaVietnamWest IndiesWestern AfricaWestern AsiaWestern EuropeYemenZaireZimbabweAzores
In Labor Force | Age 20-64
Income
Poverty
Unemployment
Labor Participation
Family Structure
Vehicle Availability
Education Level
Disability

In Labor Force | Age 20-64 Comparison

Immigrants from Armenia

Immigrants from Eastern Europe

Poor
Exceptional
79.2%
IN LABOR FORCE | AGE 20-64
12.2/ 100
METRIC RATING
214th/ 347
METRIC RANK
80.2%
IN LABOR FORCE | AGE 20-64
98.1/ 100
METRIC RATING
74th/ 347
METRIC RANK

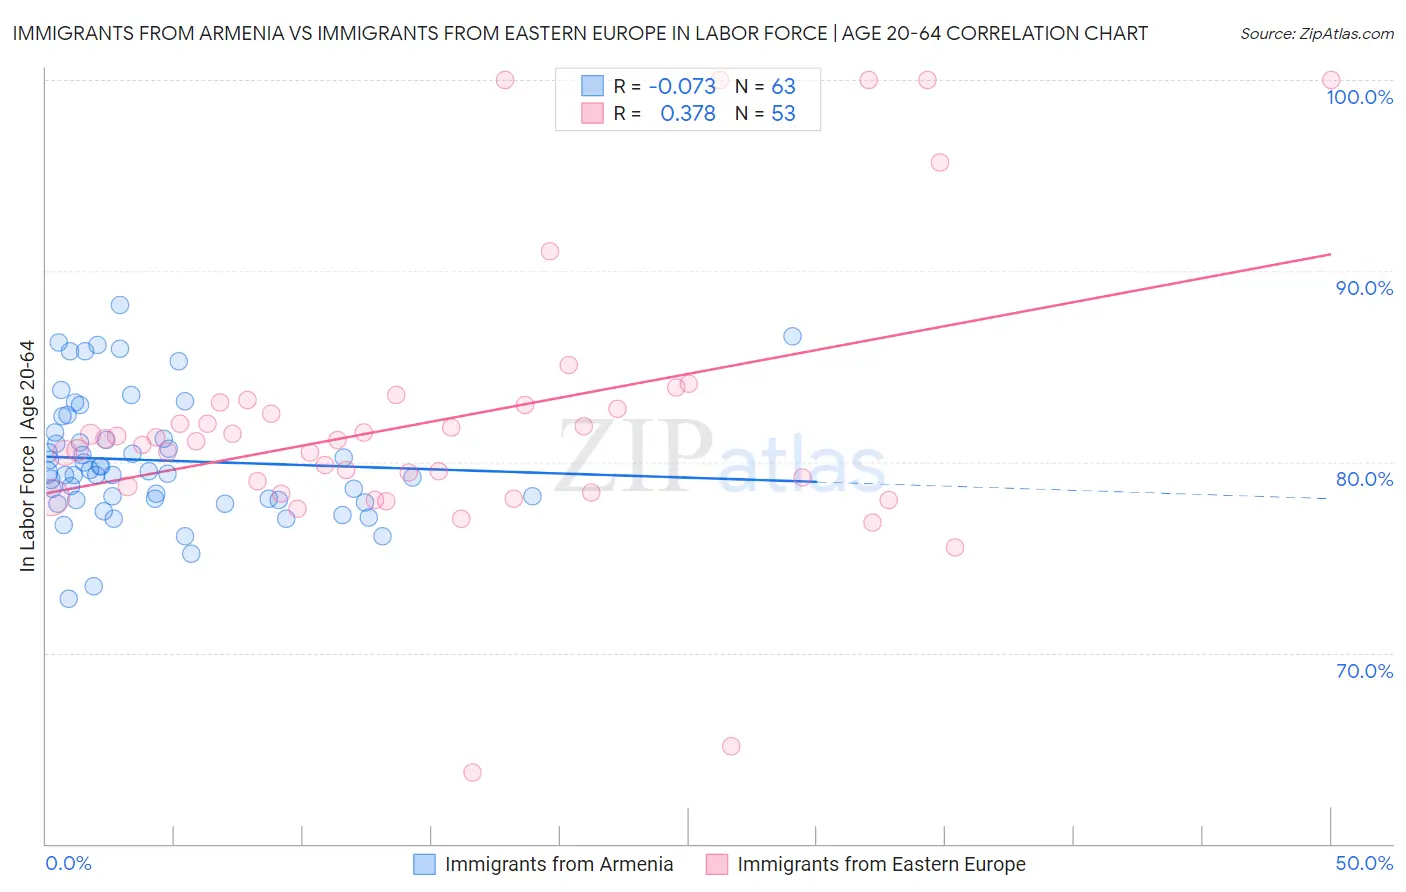
Immigrants from Armenia vs Immigrants from Eastern Europe In Labor Force | Age 20-64 Correlation Chart

The statistical analysis conducted on geographies consisting of 97,718,343 people shows a slight negative correlation between the proportion of Immigrants from Armenia and labor force participation rate among population between the ages 20 and 64 in the United States with a correlation coefficient (R) of -0.073 and weighted average of 79.2%. Similarly, the statistical analysis conducted on geographies consisting of 475,884,691 people shows a mild positive correlation between the proportion of Immigrants from Eastern Europe and labor force participation rate among population between the ages 20 and 64 in the United States with a correlation coefficient (R) of 0.378 and weighted average of 80.2%, a difference of 1.2%.
Immigrants from Armenia vs Immigrants from Eastern Europe In Labor Force | Age 20-64

In Labor Force | Age 20-64 Correlation Summary

MeasurementImmigrants from ArmeniaImmigrants from Eastern Europe
Minimum72.8%63.7%
Maximum88.2%100.0%
Range15.4%36.3%
Mean80.1%82.2%
Median79.5%81.1%
Interquartile 25% (IQ1)78.0%78.6%
Interquartile 75% (IQ3)81.5%83.1%
Interquartile Range (IQR)3.5%4.5%
Standard Deviation (Sample)3.2%7.4%
Standard Deviation (Population)3.2%7.3%

Similar Demographics by In Labor Force | Age 20-64

Demographics Similar to Immigrants from Armenia by In Labor Force | Age 20-64

In terms of in labor force | age 20-64, the demographic groups most similar to Immigrants from Armenia are Immigrants from Norway (79.2%, a difference of 0.0%), Immigrants from Portugal (79.3%, a difference of 0.010%), Arab (79.2%, a difference of 0.010%), Irish (79.3%, a difference of 0.020%), and Immigrants from Western Asia (79.2%, a difference of 0.020%).
DemographicsRating | RankIn Labor Force | Age 20-64
Sub-Saharan Africans
16.5
/100
|
#207
Poor
79.3%
British
16.5
/100
|
#208
Poor
79.3%
Bangladeshis
16.4
/100
|
#209
Poor
79.3%
Haitians
16.1
/100
|
#210
Poor
79.3%
Europeans
15.3
/100
|
#211
Poor
79.3%
Irish
13.2
/100
|
#212
Poor
79.3%
Immigrants | Portugal
12.8
/100
|
#213
Poor
79.3%
Immigrants | Armenia
12.2
/100
|
#214
Poor
79.2%
Immigrants | Norway
12.0
/100
|
#215
Poor
79.2%
Arabs
11.4
/100
|
#216
Poor
79.2%
Immigrants | Western Asia
11.0
/100
|
#217
Poor
79.2%
Immigrants | England
9.3
/100
|
#218
Tragic
79.2%
French Canadians
8.4
/100
|
#219
Tragic
79.2%
Immigrants | Immigrants
7.7
/100
|
#220
Tragic
79.2%
Hungarians
7.2
/100
|
#221
Tragic
79.2%

Demographics Similar to Immigrants from Eastern Europe by In Labor Force | Age 20-64

In terms of in labor force | age 20-64, the demographic groups most similar to Immigrants from Eastern Europe are Cypriot (80.2%, a difference of 0.010%), Immigrants from Afghanistan (80.2%, a difference of 0.010%), Egyptian (80.2%, a difference of 0.030%), Immigrants from Colombia (80.2%, a difference of 0.030%), and Immigrants from Romania (80.2%, a difference of 0.030%).
DemographicsRating | RankIn Labor Force | Age 20-64
Taiwanese
98.6
/100
|
#67
Exceptional
80.2%
Bhutanese
98.6
/100
|
#68
Exceptional
80.2%
Albanians
98.6
/100
|
#69
Exceptional
80.2%
Immigrants | Turkey
98.5
/100
|
#70
Exceptional
80.2%
Soviet Union
98.5
/100
|
#71
Exceptional
80.2%
Eastern Europeans
98.4
/100
|
#72
Exceptional
80.2%
Cypriots
98.2
/100
|
#73
Exceptional
80.2%
Immigrants | Eastern Europe
98.1
/100
|
#74
Exceptional
80.2%
Immigrants | Afghanistan
97.9
/100
|
#75
Exceptional
80.2%
Egyptians
97.8
/100
|
#76
Exceptional
80.2%
Immigrants | Colombia
97.8
/100
|
#77
Exceptional
80.2%
Immigrants | Romania
97.8
/100
|
#78
Exceptional
80.2%
Asians
97.7
/100
|
#79
Exceptional
80.2%
Immigrants | Croatia
97.6
/100
|
#80
Exceptional
80.1%
German Russians
97.3
/100
|
#81
Exceptional
80.1%