Immigrants from Africa vs Iroquois In Labor Force | Age 35-44
COMPARE
Immigrants from Africa
Iroquois
In Labor Force | Age 35-44
In Labor Force | Age 35-44 Comparison
Immigrants from Africa
Iroquois
84.9%
IN LABOR FORCE | AGE 35-44
98.4/ 100
METRIC RATING
78th/ 347
METRIC RANK
83.5%
IN LABOR FORCE | AGE 35-44
0.2/ 100
METRIC RATING
263rd/ 347
METRIC RANK
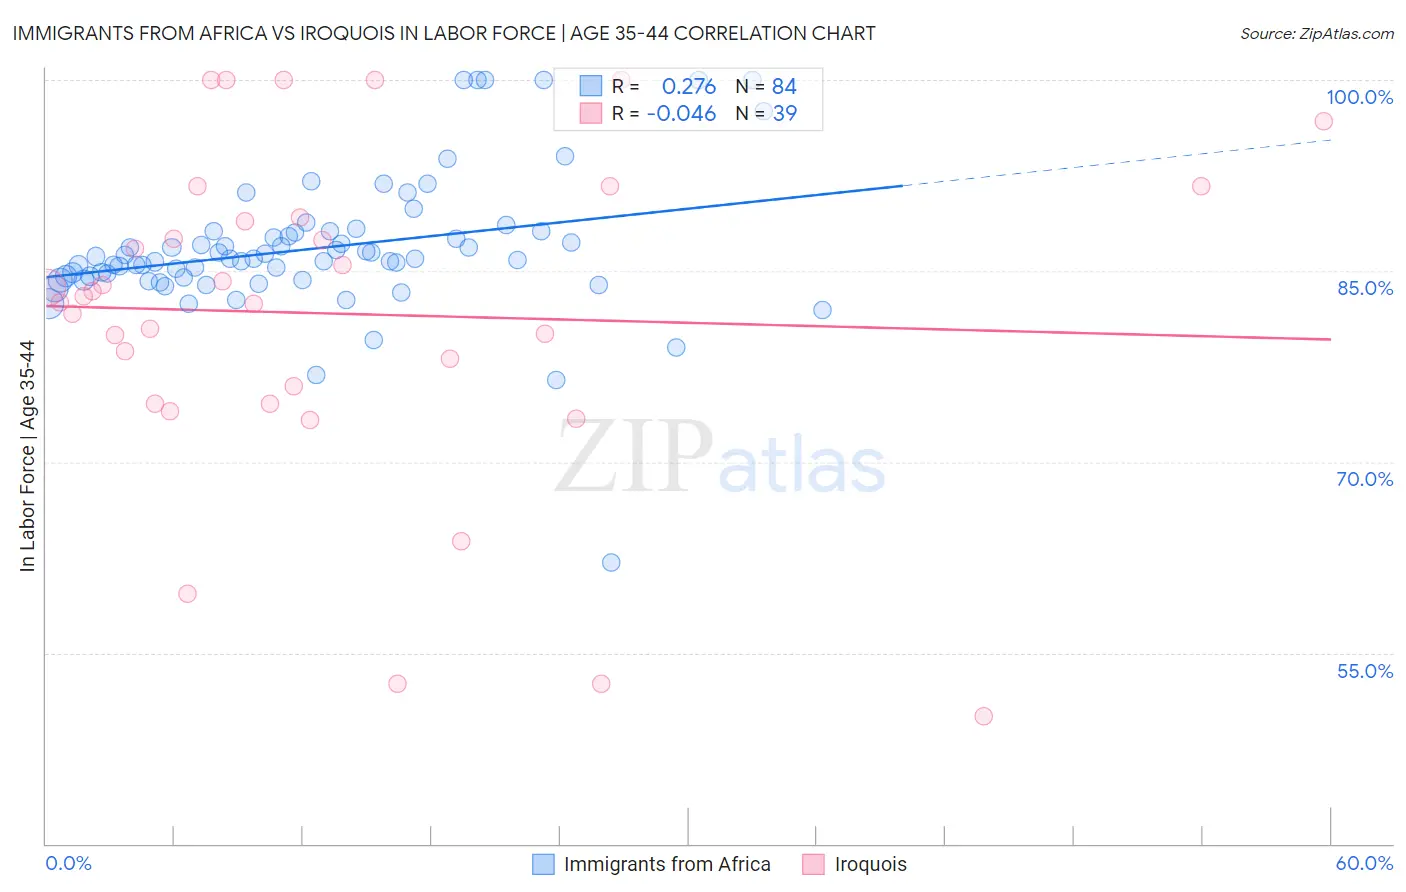
Immigrants from Africa vs Iroquois In Labor Force | Age 35-44 Correlation Chart
The statistical analysis conducted on geographies consisting of 469,061,471 people shows a weak positive correlation between the proportion of Immigrants from Africa and labor force participation rate among population between the ages 35 and 44 in the United States with a correlation coefficient (R) of 0.276 and weighted average of 84.9%. Similarly, the statistical analysis conducted on geographies consisting of 207,246,504 people shows no correlation between the proportion of Iroquois and labor force participation rate among population between the ages 35 and 44 in the United States with a correlation coefficient (R) of -0.046 and weighted average of 83.5%, a difference of 1.7%.
In Labor Force | Age 35-44 Correlation Summary
| Measurement | Immigrants from Africa | Iroquois |
| Minimum | 62.1% | 50.0% |
| Maximum | 100.0% | 100.0% |
| Range | 37.9% | 50.0% |
| Mean | 86.8% | 81.6% |
| Median | 86.0% | 83.1% |
| Interquartile 25% (IQ1) | 84.4% | 74.6% |
| Interquartile 75% (IQ3) | 88.0% | 89.2% |
| Interquartile Range (IQR) | 3.7% | 14.6% |
| Standard Deviation (Sample) | 5.6% | 12.9% |
| Standard Deviation (Population) | 5.5% | 12.7% |
Similar Demographics by In Labor Force | Age 35-44
Demographics Similar to Immigrants from Africa by In Labor Force | Age 35-44
In terms of in labor force | age 35-44, the demographic groups most similar to Immigrants from Africa are Peruvian (84.9%, a difference of 0.0%), Immigrants from Colombia (84.9%, a difference of 0.010%), Immigrants from Eastern Europe (84.9%, a difference of 0.010%), Immigrants from South Central Asia (85.0%, a difference of 0.030%), and Immigrants from Cuba (84.9%, a difference of 0.030%).
| Demographics | Rating | Rank | In Labor Force | Age 35-44 |
| Russians | 99.0 /100 | #71 | Exceptional 85.0% |
| Immigrants | Singapore | 98.9 /100 | #72 | Exceptional 85.0% |
| Immigrants | Sri Lanka | 98.9 /100 | #73 | Exceptional 85.0% |
| Colombians | 98.8 /100 | #74 | Exceptional 85.0% |
| Immigrants | South Central Asia | 98.7 /100 | #75 | Exceptional 85.0% |
| Immigrants | Cuba | 98.6 /100 | #76 | Exceptional 84.9% |
| Immigrants | Turkey | 98.6 /100 | #77 | Exceptional 84.9% |
| Immigrants | Africa | 98.4 /100 | #78 | Exceptional 84.9% |
| Peruvians | 98.3 /100 | #79 | Exceptional 84.9% |
| Immigrants | Colombia | 98.3 /100 | #80 | Exceptional 84.9% |
| Immigrants | Eastern Europe | 98.3 /100 | #81 | Exceptional 84.9% |
| Immigrants | Sudan | 98.1 /100 | #82 | Exceptional 84.9% |
| Senegalese | 97.8 /100 | #83 | Exceptional 84.9% |
| Immigrants | Peru | 97.8 /100 | #84 | Exceptional 84.9% |
| Immigrants | Middle Africa | 97.8 /100 | #85 | Exceptional 84.9% |
Demographics Similar to Iroquois by In Labor Force | Age 35-44
In terms of in labor force | age 35-44, the demographic groups most similar to Iroquois are Immigrants from Dominica (83.5%, a difference of 0.030%), Immigrants from Congo (83.5%, a difference of 0.030%), Scotch-Irish (83.5%, a difference of 0.030%), Vietnamese (83.5%, a difference of 0.040%), and Central American (83.5%, a difference of 0.040%).
| Demographics | Rating | Rank | In Labor Force | Age 35-44 |
| Japanese | 0.3 /100 | #256 | Tragic 83.6% |
| Basques | 0.3 /100 | #257 | Tragic 83.6% |
| Tsimshian | 0.2 /100 | #258 | Tragic 83.5% |
| Immigrants | El Salvador | 0.2 /100 | #259 | Tragic 83.5% |
| Vietnamese | 0.2 /100 | #260 | Tragic 83.5% |
| Immigrants | Dominica | 0.2 /100 | #261 | Tragic 83.5% |
| Immigrants | Congo | 0.2 /100 | #262 | Tragic 83.5% |
| Iroquois | 0.2 /100 | #263 | Tragic 83.5% |
| Scotch-Irish | 0.1 /100 | #264 | Tragic 83.5% |
| Central Americans | 0.1 /100 | #265 | Tragic 83.5% |
| Spaniards | 0.1 /100 | #266 | Tragic 83.4% |
| Guamanians/Chamorros | 0.1 /100 | #267 | Tragic 83.4% |
| Hondurans | 0.1 /100 | #268 | Tragic 83.4% |
| Immigrants | Grenada | 0.1 /100 | #269 | Tragic 83.3% |
| Immigrants | Honduras | 0.0 /100 | #270 | Tragic 83.3% |