Ecuadorian vs Immigrants from Lithuania In Labor Force | Age 20-24

COMPARE

Ecuadorian
Race
Ancestry
AfghanAfricanAlaska NativeAlaskan AthabascanAlbanianAleutAlsatianAmericanApacheArabArapahoArgentineanArmenianAssyrian/Chaldean/SyriacAustralianAustrianBahamianBangladeshiBarbadianBasqueBelgianBelizeanBermudanBhutaneseBlackfeetBolivianBrazilianBritishBritish West IndianBulgarianBurmeseCajunCambodianCanadianCape VerdeanCarpatho RusynCelticCentral AmericanCentral American IndianCherokeeCheyenneChickasawChileanChineseChippewaChoctawColombianColvilleComancheCosta RicanCreeCreekCroatianCrowCubanCypriotCzechCzechoslovakianDanishDelawareDominicanDutchDutch West IndianEastern EuropeanEcuadorianEgyptianEnglishEstonianEthiopianEuropeanFijianFilipinoFinnishFrenchFrench American IndianFrench CanadianGermanGerman RussianGhanaianGreekGuamanian/ChamorroGuatemalanGuyaneseHaitianHmongHonduranHopiHoumaHungarianIcelanderIndian (Asian)IndonesianInupiatIranianIraqiIrishIroquoisIsraeliItalianJamaicanJapaneseJordanianKenyanKiowaKoreanLaotianLatvianLebaneseLiberianLithuanianLumbeeLuxembourgerMacedonianMalaysianMalteseMarshalleseMenomineeMexicanMexican American IndianMongolianMoroccanNative HawaiianNavajoNepaleseNew ZealanderNicaraguanNigerianNorthern EuropeanNorwegianOkinawanOsageOttawaPaiutePakistaniPalestinianPanamanianParaguayanPennsylvania GermanPeruvianPimaPolishPortuguesePotawatomiPuebloPuerto RicanPuget Sound SalishRomanianRussianSalvadoranSamoanScandinavianScotch-IrishScottishSeminoleSenegaleseSerbianShoshoneSierra LeoneanSiouxSlavicSlovakSloveneSomaliSouth AfricanSouth AmericanSouth American IndianSoviet UnionSpaniardSpanishSpanish AmericanSpanish American IndianSri LankanSubsaharan AfricanSudaneseSwedishSwissSyrianTaiwaneseThaiTlingit-HaidaTohono O'OdhamTonganTrinidadian and TobagonianTsimshianTurkishU.S. Virgin IslanderUgandanUkrainianUruguayanUteVenezuelanVietnameseWelshWest IndianYakamaYaquiYugoslavianYumanYup'ikZimbabwean
Immigration
NonimmigrantsImmigrantsAfghanistanAfricaAlbaniaArgentinaArmeniaAsiaAustraliaAustriaBahamasBangladeshBarbadosBelarusBelgiumBelizeBoliviaBosnia and HerzegovinaBrazilBulgariaBurma/MyanmarCabo VerdeCambodiaCameroonCanadaCaribbeanCentral AmericaChileChinaColombiaCongoCosta RicaCroatiaCubaCzechoslovakiaDenmarkDominicaDominican RepublicEastern AfricaEastern AsiaEastern EuropeEcuadorEgyptEl SalvadorEnglandEritreaEthiopiaEuropeFijiFranceGermanyGhanaGreeceGrenadaGuatemalaGuyanaHaitiHondurasHong KongHungaryIndiaIndonesiaIranIraqIrelandIsraelItalyJamaicaJapanJordanKazakhstanKenyaKoreaKuwaitLaosLatin AmericaLatviaLebanonLiberiaMalaysiaMexicoMicronesiaMiddle AfricaMoldovaMoroccoNepalNetherlandsNicaraguaNigeriaNorth AmericaNorth MacedoniaNorthern AfricaNorthern EuropeNorwayOceaniaPakistanPanamaPeruPhilippinesPolandPortugalRomaniaRussiaSaudi ArabiaScotlandSenegalSerbiaSierra LeoneSingaporeSomaliaSouth AfricaSouth AmericaSouth Central AsiaSouth Eastern AsiaSouthern EuropeSpainSri LankaSt. Vincent and the GrenadinesSudanSwedenSwitzerlandSyriaTaiwanThailandTrinidad and TobagoTurkeyUgandaUkraineUruguayUzbekistanVenezuelaVietnamWest IndiesWestern AfricaWestern AsiaWestern EuropeYemenZaireZimbabweAzores
Immigrants from Lithuania
Race
Ancestry
AfghanAfricanAlaska NativeAlaskan AthabascanAlbanianAleutAlsatianAmericanApacheArabArapahoArgentineanArmenianAssyrian/Chaldean/SyriacAustralianAustrianBahamianBangladeshiBarbadianBasqueBelgianBelizeanBermudanBhutaneseBlackfeetBolivianBrazilianBritishBritish West IndianBulgarianBurmeseCajunCambodianCanadianCape VerdeanCarpatho RusynCelticCentral AmericanCentral American IndianCherokeeCheyenneChickasawChileanChineseChippewaChoctawColombianColvilleComancheCosta RicanCreeCreekCroatianCrowCubanCypriotCzechCzechoslovakianDanishDelawareDominicanDutchDutch West IndianEastern EuropeanEgyptianEnglishEstonianEthiopianEuropeanFijianFilipinoFinnishFrenchFrench American IndianFrench CanadianGermanGerman RussianGhanaianGreekGuamanian/ChamorroGuatemalanGuyaneseHaitianHmongHonduranHopiHoumaHungarianIcelanderIndian (Asian)IndonesianInupiatIranianIraqiIrishIroquoisIsraeliItalianJamaicanJapaneseJordanianKenyanKiowaKoreanLaotianLatvianLebaneseLiberianLithuanianLumbeeLuxembourgerMacedonianMalaysianMalteseMarshalleseMenomineeMexicanMexican American IndianMongolianMoroccanNative HawaiianNavajoNepaleseNew ZealanderNicaraguanNigerianNorthern EuropeanNorwegianOkinawanOsageOttawaPaiutePakistaniPalestinianPanamanianParaguayanPennsylvania GermanPeruvianPimaPolishPortuguesePotawatomiPuebloPuerto RicanPuget Sound SalishRomanianRussianSalvadoranSamoanScandinavianScotch-IrishScottishSeminoleSenegaleseSerbianShoshoneSierra LeoneanSiouxSlavicSlovakSloveneSomaliSouth AfricanSouth AmericanSouth American IndianSoviet UnionSpaniardSpanishSpanish AmericanSpanish American IndianSri LankanSubsaharan AfricanSudaneseSwedishSwissSyrianTaiwaneseThaiTlingit-HaidaTohono O'OdhamTonganTrinidadian and TobagonianTsimshianTurkishU.S. Virgin IslanderUgandanUkrainianUruguayanUteVenezuelanVietnameseWelshWest IndianYakamaYaquiYugoslavianYumanYup'ikZimbabwean
Immigration
NonimmigrantsImmigrantsAfghanistanAfricaAlbaniaArgentinaArmeniaAsiaAustraliaAustriaBahamasBangladeshBarbadosBelarusBelgiumBelizeBoliviaBosnia and HerzegovinaBrazilBulgariaBurma/MyanmarCabo VerdeCambodiaCameroonCanadaCaribbeanCentral AmericaChileChinaColombiaCongoCosta RicaCroatiaCubaCzechoslovakiaDenmarkDominicaDominican RepublicEastern AfricaEastern AsiaEastern EuropeEcuadorEgyptEl SalvadorEnglandEritreaEthiopiaEuropeFijiFranceGermanyGhanaGreeceGrenadaGuatemalaGuyanaHaitiHondurasHong KongHungaryIndiaIndonesiaIranIraqIrelandIsraelItalyJamaicaJapanJordanKazakhstanKenyaKoreaKuwaitLaosLatin AmericaLatviaLebanonLiberiaLithuaniaMalaysiaMexicoMicronesiaMiddle AfricaMoldovaMoroccoNepalNetherlandsNicaraguaNigeriaNorth AmericaNorth MacedoniaNorthern AfricaNorthern EuropeNorwayOceaniaPakistanPanamaPeruPhilippinesPolandPortugalRomaniaRussiaSaudi ArabiaScotlandSenegalSerbiaSierra LeoneSingaporeSomaliaSouth AfricaSouth AmericaSouth Central AsiaSouth Eastern AsiaSouthern EuropeSpainSri LankaSt. Vincent and the GrenadinesSudanSwedenSwitzerlandSyriaTaiwanThailandTrinidad and TobagoTurkeyUgandaUkraineUruguayUzbekistanVenezuelaVietnamWest IndiesWestern AfricaWestern AsiaWestern EuropeYemenZaireZimbabweAzores
In Labor Force | Age 20-24
Income
Poverty
Unemployment
Labor Participation
Family Structure
Vehicle Availability
Education Level
Disability

In Labor Force | Age 20-24 Comparison

Ecuadorians

Immigrants from Lithuania

Tragic
Exceptional
72.4%
IN LABOR FORCE | AGE 20-24
0.0/ 100
METRIC RATING
303rd/ 347
METRIC RANK
76.1%
IN LABOR FORCE | AGE 20-24
98.0/ 100
METRIC RATING
97th/ 347
METRIC RANK

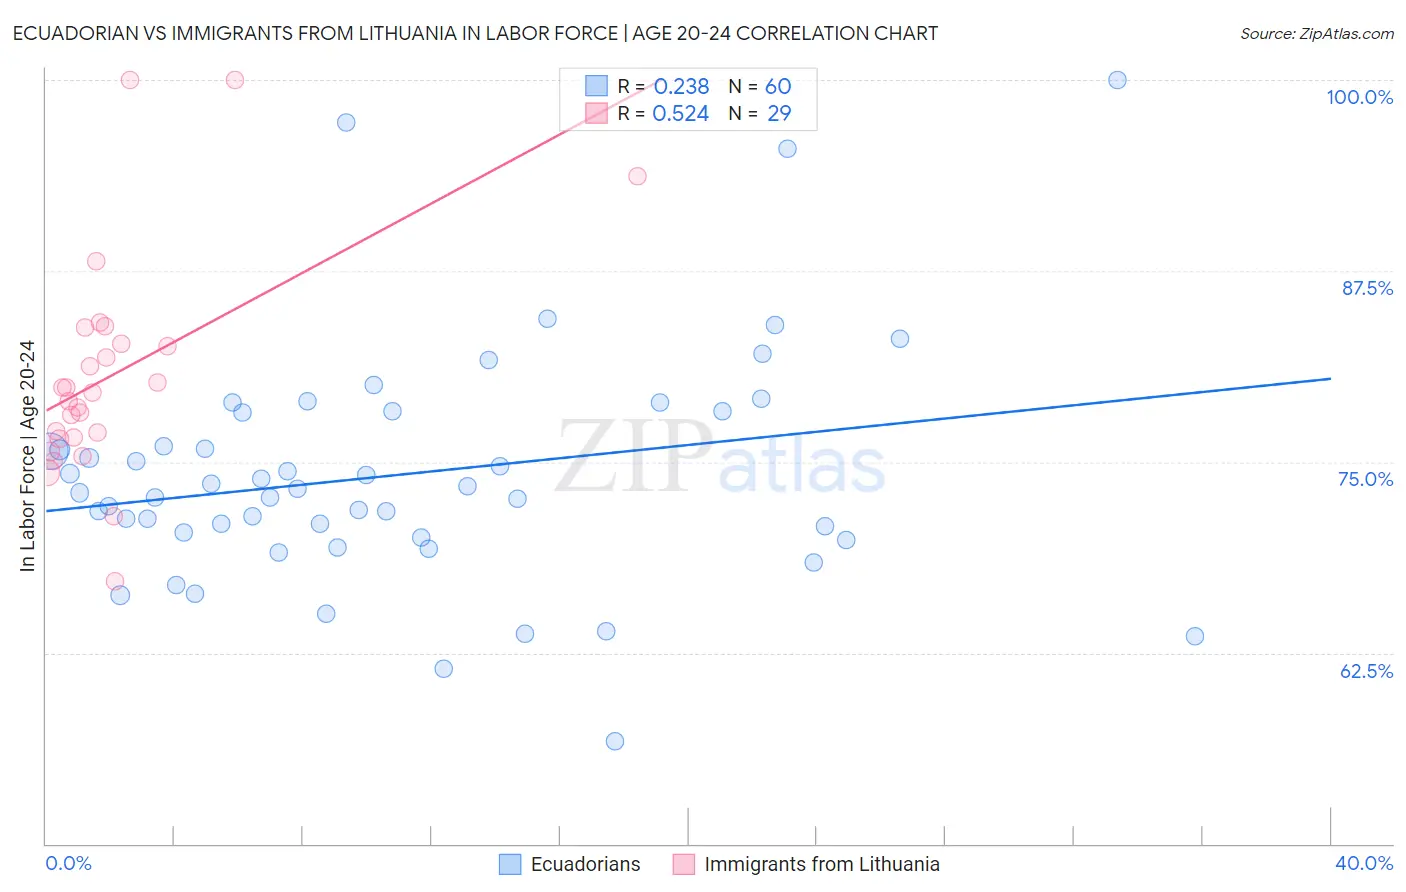
Ecuadorian vs Immigrants from Lithuania In Labor Force | Age 20-24 Correlation Chart

The statistical analysis conducted on geographies consisting of 317,809,827 people shows a weak positive correlation between the proportion of Ecuadorians and labor force participation rate among population between the ages 20 and 24 in the United States with a correlation coefficient (R) of 0.238 and weighted average of 72.4%. Similarly, the statistical analysis conducted on geographies consisting of 117,715,307 people shows a substantial positive correlation between the proportion of Immigrants from Lithuania and labor force participation rate among population between the ages 20 and 24 in the United States with a correlation coefficient (R) of 0.524 and weighted average of 76.1%, a difference of 5.1%.
Ecuadorian vs Immigrants from Lithuania In Labor Force | Age 20-24

In Labor Force | Age 20-24 Correlation Summary

MeasurementEcuadorianImmigrants from Lithuania
Minimum56.7%67.2%
Maximum100.0%100.0%
Range43.3%32.8%
Mean74.2%80.7%
Median73.1%79.5%
Interquartile 25% (IQ1)70.2%76.6%
Interquartile 75% (IQ3)78.2%83.2%
Interquartile Range (IQR)8.0%6.7%
Standard Deviation (Sample)7.7%7.3%
Standard Deviation (Population)7.7%7.2%

Similar Demographics by In Labor Force | Age 20-24

Demographics Similar to Ecuadorians by In Labor Force | Age 20-24

In terms of in labor force | age 20-24, the demographic groups most similar to Ecuadorians are Native/Alaskan (72.4%, a difference of 0.010%), Immigrants from West Indies (72.4%, a difference of 0.010%), Immigrants from Singapore (72.4%, a difference of 0.040%), Immigrants from Jamaica (72.4%, a difference of 0.060%), and Cuban (72.5%, a difference of 0.10%).
DemographicsRating | RankIn Labor Force | Age 20-24
Jamaicans
0.0
/100
|
#296
Tragic
72.7%
Central American Indians
0.0
/100
|
#297
Tragic
72.7%
Israelis
0.0
/100
|
#298
Tragic
72.6%
Iranians
0.0
/100
|
#299
Tragic
72.6%
Armenians
0.0
/100
|
#300
Tragic
72.5%
Cubans
0.0
/100
|
#301
Tragic
72.5%
Natives/Alaskans
0.0
/100
|
#302
Tragic
72.4%
Ecuadorians
0.0
/100
|
#303
Tragic
72.4%
Immigrants | West Indies
0.0
/100
|
#304
Tragic
72.4%
Immigrants | Singapore
0.0
/100
|
#305
Tragic
72.4%
Immigrants | Jamaica
0.0
/100
|
#306
Tragic
72.4%
Immigrants | Ecuador
0.0
/100
|
#307
Tragic
72.3%
Soviet Union
0.0
/100
|
#308
Tragic
72.3%
Tsimshian
0.0
/100
|
#309
Tragic
72.3%
Immigrants | Cuba
0.0
/100
|
#310
Tragic
72.0%

Demographics Similar to Immigrants from Lithuania by In Labor Force | Age 20-24

In terms of in labor force | age 20-24, the demographic groups most similar to Immigrants from Lithuania are Immigrants from Oceania (76.1%, a difference of 0.0%), American (76.1%, a difference of 0.030%), Shoshone (76.1%, a difference of 0.040%), Immigrants from Poland (76.1%, a difference of 0.050%), and Latvian (76.1%, a difference of 0.060%).
DemographicsRating | RankIn Labor Force | Age 20-24
Immigrants | Burma/Myanmar
99.1
/100
|
#90
Exceptional
76.3%
Sierra Leoneans
99.0
/100
|
#91
Exceptional
76.3%
Maltese
98.9
/100
|
#92
Exceptional
76.3%
Hungarians
98.9
/100
|
#93
Exceptional
76.3%
Potawatomi
98.5
/100
|
#94
Exceptional
76.2%
Immigrants | Germany
98.5
/100
|
#95
Exceptional
76.2%
Immigrants | Nonimmigrants
98.5
/100
|
#96
Exceptional
76.2%
Immigrants | Lithuania
98.0
/100
|
#97
Exceptional
76.1%
Immigrants | Oceania
98.0
/100
|
#98
Exceptional
76.1%
Americans
97.8
/100
|
#99
Exceptional
76.1%
Shoshone
97.8
/100
|
#100
Exceptional
76.1%
Immigrants | Poland
97.7
/100
|
#101
Exceptional
76.1%
Latvians
97.6
/100
|
#102
Exceptional
76.1%
Immigrants | North Macedonia
97.5
/100
|
#103
Exceptional
76.1%
Macedonians
97.2
/100
|
#104
Exceptional
76.0%