Central American Indian vs Brazilian In Labor Force | Age 20-24

COMPARE

Central American Indian
Race
Ancestry
AfghanAfricanAlaska NativeAlaskan AthabascanAlbanianAleutAlsatianAmericanApacheArabArapahoArgentineanArmenianAssyrian/Chaldean/SyriacAustralianAustrianBahamianBangladeshiBarbadianBasqueBelgianBelizeanBermudanBhutaneseBlackfeetBolivianBritishBritish West IndianBulgarianBurmeseCajunCambodianCanadianCape VerdeanCarpatho RusynCelticCentral AmericanCentral American IndianCherokeeCheyenneChickasawChileanChineseChippewaChoctawColombianColvilleComancheCosta RicanCreeCreekCroatianCrowCubanCypriotCzechCzechoslovakianDanishDelawareDominicanDutchDutch West IndianEastern EuropeanEcuadorianEgyptianEnglishEstonianEthiopianEuropeanFijianFilipinoFinnishFrenchFrench American IndianFrench CanadianGermanGerman RussianGhanaianGreekGuamanian/ChamorroGuatemalanGuyaneseHaitianHmongHonduranHopiHoumaHungarianIcelanderIndian (Asian)IndonesianInupiatIranianIraqiIrishIroquoisIsraeliItalianJamaicanJapaneseJordanianKenyanKiowaKoreanLaotianLatvianLebaneseLiberianLithuanianLumbeeLuxembourgerMacedonianMalaysianMalteseMarshalleseMenomineeMexicanMexican American IndianMongolianMoroccanNative HawaiianNavajoNepaleseNew ZealanderNicaraguanNigerianNorthern EuropeanNorwegianOkinawanOsageOttawaPaiutePakistaniPalestinianPanamanianParaguayanPennsylvania GermanPeruvianPimaPolishPortuguesePotawatomiPuebloPuerto RicanPuget Sound SalishRomanianRussianSalvadoranSamoanScandinavianScotch-IrishScottishSeminoleSenegaleseSerbianShoshoneSierra LeoneanSiouxSlavicSlovakSloveneSomaliSouth AfricanSouth AmericanSouth American IndianSoviet UnionSpaniardSpanishSpanish AmericanSpanish American IndianSri LankanSubsaharan AfricanSudaneseSwedishSwissSyrianTaiwaneseThaiTlingit-HaidaTohono O'OdhamTonganTrinidadian and TobagonianTsimshianTurkishU.S. Virgin IslanderUgandanUkrainianUruguayanUteVenezuelanVietnameseWelshWest IndianYakamaYaquiYugoslavianYumanYup'ikZimbabwean
Immigration
NonimmigrantsImmigrantsAfghanistanAfricaAlbaniaArgentinaArmeniaAsiaAustraliaAustriaBahamasBangladeshBarbadosBelarusBelgiumBelizeBoliviaBosnia and HerzegovinaBrazilBulgariaBurma/MyanmarCabo VerdeCambodiaCameroonCanadaCaribbeanCentral AmericaChileChinaColombiaCongoCosta RicaCroatiaCubaCzechoslovakiaDenmarkDominicaDominican RepublicEastern AfricaEastern AsiaEastern EuropeEcuadorEgyptEl SalvadorEnglandEritreaEthiopiaEuropeFijiFranceGermanyGhanaGreeceGrenadaGuatemalaGuyanaHaitiHondurasHong KongHungaryIndiaIndonesiaIranIraqIrelandIsraelItalyJamaicaJapanJordanKazakhstanKenyaKoreaKuwaitLaosLatin AmericaLatviaLebanonLiberiaLithuaniaMalaysiaMexicoMicronesiaMiddle AfricaMoldovaMoroccoNepalNetherlandsNicaraguaNigeriaNorth AmericaNorth MacedoniaNorthern AfricaNorthern EuropeNorwayOceaniaPakistanPanamaPeruPhilippinesPolandPortugalRomaniaRussiaSaudi ArabiaScotlandSenegalSerbiaSierra LeoneSingaporeSomaliaSouth AfricaSouth AmericaSouth Central AsiaSouth Eastern AsiaSouthern EuropeSpainSri LankaSt. Vincent and the GrenadinesSudanSwedenSwitzerlandSyriaTaiwanThailandTrinidad and TobagoTurkeyUgandaUkraineUruguayUzbekistanVenezuelaVietnamWest IndiesWestern AfricaWestern AsiaWestern EuropeYemenZaireZimbabweAzores
Brazilian
Race
Ancestry
AfghanAfricanAlaska NativeAlaskan AthabascanAlbanianAleutAlsatianAmericanApacheArabArapahoArgentineanArmenianAssyrian/Chaldean/SyriacAustralianAustrianBahamianBangladeshiBarbadianBasqueBelgianBelizeanBermudanBhutaneseBlackfeetBolivianBrazilianBritishBritish West IndianBulgarianBurmeseCajunCambodianCanadianCape VerdeanCarpatho RusynCelticCentral AmericanCherokeeCheyenneChickasawChileanChineseChippewaChoctawColombianColvilleComancheCosta RicanCreeCreekCroatianCrowCubanCypriotCzechCzechoslovakianDanishDelawareDominicanDutchDutch West IndianEastern EuropeanEcuadorianEgyptianEnglishEstonianEthiopianEuropeanFijianFilipinoFinnishFrenchFrench American IndianFrench CanadianGermanGerman RussianGhanaianGreekGuamanian/ChamorroGuatemalanGuyaneseHaitianHmongHonduranHopiHoumaHungarianIcelanderIndian (Asian)IndonesianInupiatIranianIraqiIrishIroquoisIsraeliItalianJamaicanJapaneseJordanianKenyanKiowaKoreanLaotianLatvianLebaneseLiberianLithuanianLumbeeLuxembourgerMacedonianMalaysianMalteseMarshalleseMenomineeMexicanMexican American IndianMongolianMoroccanNative HawaiianNavajoNepaleseNew ZealanderNicaraguanNigerianNorthern EuropeanNorwegianOkinawanOsageOttawaPaiutePakistaniPalestinianPanamanianParaguayanPennsylvania GermanPeruvianPimaPolishPortuguesePotawatomiPuebloPuerto RicanPuget Sound SalishRomanianRussianSalvadoranSamoanScandinavianScotch-IrishScottishSeminoleSenegaleseSerbianShoshoneSierra LeoneanSiouxSlavicSlovakSloveneSomaliSouth AfricanSouth AmericanSouth American IndianSoviet UnionSpaniardSpanishSpanish AmericanSpanish American IndianSri LankanSubsaharan AfricanSudaneseSwedishSwissSyrianTaiwaneseThaiTlingit-HaidaTohono O'OdhamTonganTrinidadian and TobagonianTsimshianTurkishU.S. Virgin IslanderUgandanUkrainianUruguayanUteVenezuelanVietnameseWelshWest IndianYakamaYaquiYugoslavianYumanYup'ikZimbabwean
Immigration
NonimmigrantsImmigrantsAfghanistanAfricaAlbaniaArgentinaArmeniaAsiaAustraliaAustriaBahamasBangladeshBarbadosBelarusBelgiumBelizeBoliviaBosnia and HerzegovinaBrazilBulgariaBurma/MyanmarCabo VerdeCambodiaCameroonCanadaCaribbeanCentral AmericaChileChinaColombiaCongoCosta RicaCroatiaCubaCzechoslovakiaDenmarkDominicaDominican RepublicEastern AfricaEastern AsiaEastern EuropeEcuadorEgyptEl SalvadorEnglandEritreaEthiopiaEuropeFijiFranceGermanyGhanaGreeceGrenadaGuatemalaGuyanaHaitiHondurasHong KongHungaryIndiaIndonesiaIranIraqIrelandIsraelItalyJamaicaJapanJordanKazakhstanKenyaKoreaKuwaitLaosLatin AmericaLatviaLebanonLiberiaLithuaniaMalaysiaMexicoMicronesiaMiddle AfricaMoldovaMoroccoNepalNetherlandsNicaraguaNigeriaNorth AmericaNorth MacedoniaNorthern AfricaNorthern EuropeNorwayOceaniaPakistanPanamaPeruPhilippinesPolandPortugalRomaniaRussiaSaudi ArabiaScotlandSenegalSerbiaSierra LeoneSingaporeSomaliaSouth AfricaSouth AmericaSouth Central AsiaSouth Eastern AsiaSouthern EuropeSpainSri LankaSt. Vincent and the GrenadinesSudanSwedenSwitzerlandSyriaTaiwanThailandTrinidad and TobagoTurkeyUgandaUkraineUruguayUzbekistanVenezuelaVietnamWest IndiesWestern AfricaWestern AsiaWestern EuropeYemenZaireZimbabweAzores
In Labor Force | Age 20-24
Income
Poverty
Unemployment
Labor Participation
Family Structure
Vehicle Availability
Education Level
Disability

In Labor Force | Age 20-24 Comparison

Central American Indians

Brazilians

Tragic
Exceptional
72.7%
IN LABOR FORCE | AGE 20-24
0.0/ 100
METRIC RATING
297th/ 347
METRIC RANK
75.8%
IN LABOR FORCE | AGE 20-24
93.0/ 100
METRIC RATING
126th/ 347
METRIC RANK

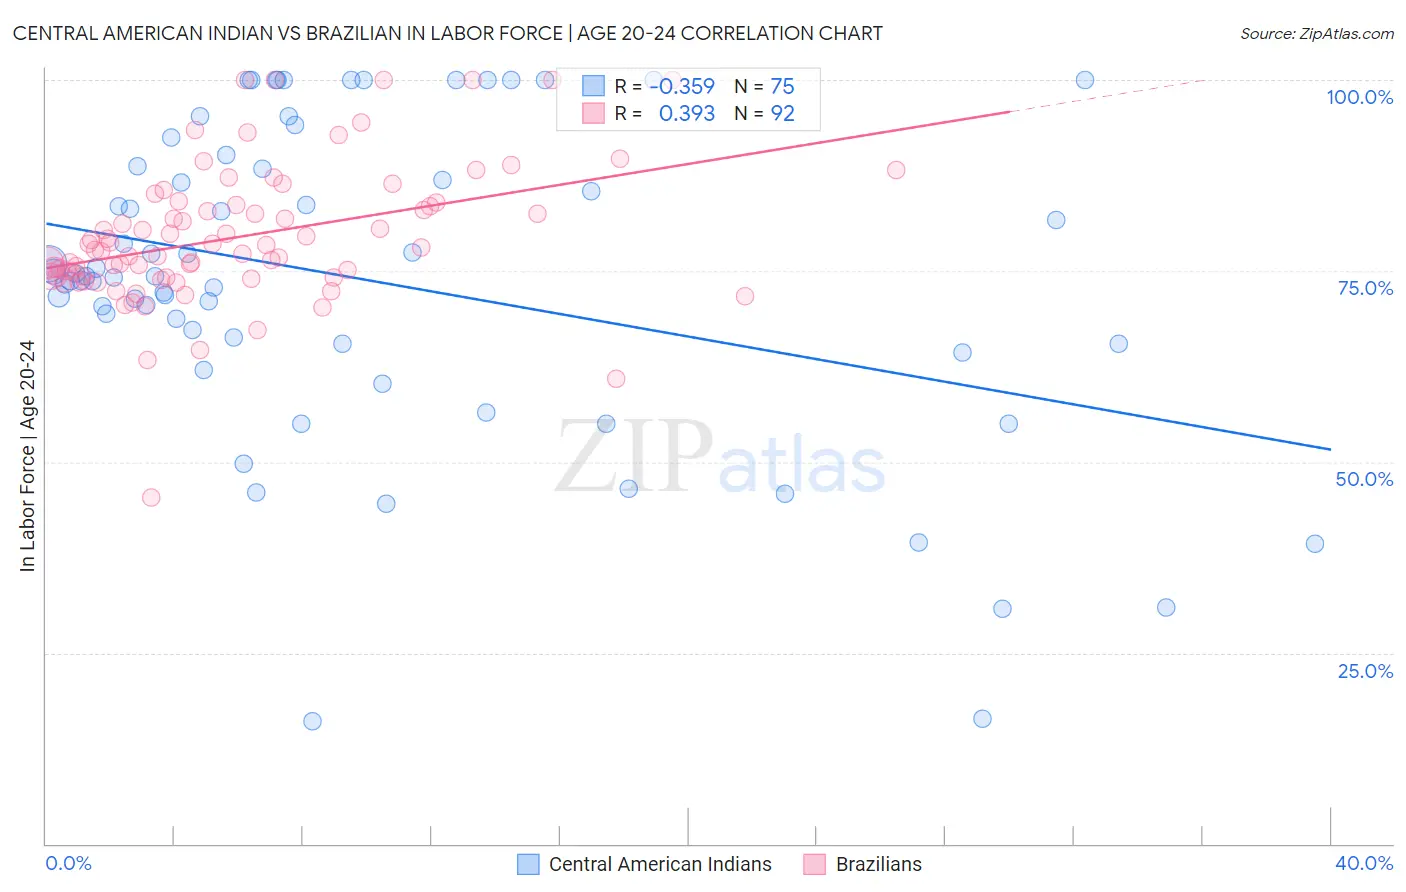
Central American Indian vs Brazilian In Labor Force | Age 20-24 Correlation Chart

The statistical analysis conducted on geographies consisting of 326,106,765 people shows a mild negative correlation between the proportion of Central American Indians and labor force participation rate among population between the ages 20 and 24 in the United States with a correlation coefficient (R) of -0.359 and weighted average of 72.7%. Similarly, the statistical analysis conducted on geographies consisting of 323,876,303 people shows a mild positive correlation between the proportion of Brazilians and labor force participation rate among population between the ages 20 and 24 in the United States with a correlation coefficient (R) of 0.393 and weighted average of 75.8%, a difference of 4.2%.
Central American Indian vs Brazilian In Labor Force | Age 20-24

In Labor Force | Age 20-24 Correlation Summary

MeasurementCentral American IndianBrazilian
Minimum16.0%45.4%
Maximum100.0%100.0%
Range84.0%54.6%
Mean73.8%79.5%
Median74.3%77.9%
Interquartile 25% (IQ1)65.5%74.2%
Interquartile 75% (IQ3)88.7%83.9%
Interquartile Range (IQR)23.2%9.7%
Standard Deviation (Sample)20.4%9.1%
Standard Deviation (Population)20.3%9.1%

Similar Demographics by In Labor Force | Age 20-24

Demographics Similar to Central American Indians by In Labor Force | Age 20-24

In terms of in labor force | age 20-24, the demographic groups most similar to Central American Indians are Okinawan (72.7%, a difference of 0.050%), Jamaican (72.7%, a difference of 0.050%), Israeli (72.6%, a difference of 0.13%), Immigrants from Argentina (72.8%, a difference of 0.16%), and Iranian (72.6%, a difference of 0.17%).
DemographicsRating | RankIn Labor Force | Age 20-24
Immigrants | Belarus
0.1
/100
|
#290
Tragic
73.0%
Immigrants | Nicaragua
0.0
/100
|
#291
Tragic
72.9%
Pueblo
0.0
/100
|
#292
Tragic
72.9%
Immigrants | Belize
0.0
/100
|
#293
Tragic
72.8%
Immigrants | Argentina
0.0
/100
|
#294
Tragic
72.8%
Okinawans
0.0
/100
|
#295
Tragic
72.7%
Jamaicans
0.0
/100
|
#296
Tragic
72.7%
Central American Indians
0.0
/100
|
#297
Tragic
72.7%
Israelis
0.0
/100
|
#298
Tragic
72.6%
Iranians
0.0
/100
|
#299
Tragic
72.6%
Armenians
0.0
/100
|
#300
Tragic
72.5%
Cubans
0.0
/100
|
#301
Tragic
72.5%
Natives/Alaskans
0.0
/100
|
#302
Tragic
72.4%
Ecuadorians
0.0
/100
|
#303
Tragic
72.4%
Immigrants | West Indies
0.0
/100
|
#304
Tragic
72.4%

Demographics Similar to Brazilians by In Labor Force | Age 20-24

In terms of in labor force | age 20-24, the demographic groups most similar to Brazilians are Immigrants from Scotland (75.8%, a difference of 0.040%), Immigrants from Sierra Leone (75.8%, a difference of 0.050%), Immigrants from Bulgaria (75.8%, a difference of 0.060%), Immigrants from Serbia (75.8%, a difference of 0.070%), and Pakistani (75.8%, a difference of 0.070%).
DemographicsRating | RankIn Labor Force | Age 20-24
Immigrants | Portugal
94.8
/100
|
#119
Exceptional
75.8%
Immigrants | Africa
94.6
/100
|
#120
Exceptional
75.8%
Immigrants | Serbia
94.3
/100
|
#121
Exceptional
75.8%
Pakistanis
94.1
/100
|
#122
Exceptional
75.8%
Immigrants | Bulgaria
94.1
/100
|
#123
Exceptional
75.8%
Immigrants | Sierra Leone
93.8
/100
|
#124
Exceptional
75.8%
Immigrants | Scotland
93.7
/100
|
#125
Exceptional
75.8%
Brazilians
93.0
/100
|
#126
Exceptional
75.8%
Sub-Saharan Africans
90.9
/100
|
#127
Exceptional
75.7%
Immigrants | Afghanistan
89.4
/100
|
#128
Excellent
75.6%
Iroquois
89.1
/100
|
#129
Excellent
75.6%
Immigrants | Austria
88.8
/100
|
#130
Excellent
75.6%
Immigrants | Jordan
88.5
/100
|
#131
Excellent
75.6%
Palestinians
88.4
/100
|
#132
Excellent
75.6%
Zimbabweans
88.2
/100
|
#133
Excellent
75.6%