Australian vs Arapaho In Labor Force | Age 30-34

COMPARE

Australian
Race
Ancestry
AfghanAfricanAlaska NativeAlaskan AthabascanAlbanianAleutAlsatianAmericanApacheArabArgentineanArmenianAssyrian/Chaldean/SyriacAustralianAustrianBahamianBangladeshiBarbadianBasqueBelgianBelizeanBermudanBhutaneseBlackfeetBolivianBrazilianBritishBritish West IndianBulgarianBurmeseCajunCambodianCanadianCape VerdeanCarpatho RusynCelticCentral AmericanCentral American IndianCherokeeCheyenneChickasawChileanChineseChippewaChoctawColombianColvilleComancheCosta RicanCreeCreekCroatianCrowCubanCypriotCzechCzechoslovakianDanishDelawareDominicanDutchDutch West IndianEastern EuropeanEcuadorianEgyptianEnglishEstonianEthiopianEuropeanFijianFilipinoFinnishFrenchFrench American IndianFrench CanadianGermanGerman RussianGhanaianGreekGuamanian/ChamorroGuatemalanGuyaneseHaitianHmongHonduranHopiHoumaHungarianIcelanderIndian (Asian)IndonesianInupiatIranianIraqiIrishIroquoisIsraeliItalianJamaicanJapaneseJordanianKenyanKiowaKoreanLaotianLatvianLebaneseLiberianLithuanianLumbeeLuxembourgerMacedonianMalaysianMalteseMarshalleseMenomineeMexicanMexican American IndianMongolianMoroccanNative HawaiianNavajoNepaleseNew ZealanderNicaraguanNigerianNorthern EuropeanNorwegianOkinawanOsageOttawaPaiutePakistaniPalestinianPanamanianParaguayanPennsylvania GermanPeruvianPimaPolishPortuguesePotawatomiPuebloPuerto RicanPuget Sound SalishRomanianRussianSalvadoranSamoanScandinavianScotch-IrishScottishSeminoleSenegaleseSerbianShoshoneSierra LeoneanSiouxSlavicSlovakSloveneSomaliSouth AfricanSouth AmericanSouth American IndianSoviet UnionSpaniardSpanishSpanish AmericanSpanish American IndianSri LankanSubsaharan AfricanSudaneseSwedishSwissSyrianTaiwaneseThaiTlingit-HaidaTohono O'OdhamTonganTrinidadian and TobagonianTsimshianTurkishU.S. Virgin IslanderUgandanUkrainianUruguayanUteVenezuelanVietnameseWelshWest IndianYakamaYaquiYugoslavianYumanYup'ikZimbabwean
Immigration
NonimmigrantsImmigrantsAfghanistanAfricaAlbaniaArgentinaArmeniaAsiaAustraliaAustriaBahamasBangladeshBarbadosBelarusBelgiumBelizeBoliviaBosnia and HerzegovinaBrazilBulgariaBurma/MyanmarCabo VerdeCambodiaCameroonCanadaCaribbeanCentral AmericaChileChinaColombiaCongoCosta RicaCroatiaCubaCzechoslovakiaDenmarkDominicaDominican RepublicEastern AfricaEastern AsiaEastern EuropeEcuadorEgyptEl SalvadorEnglandEritreaEthiopiaEuropeFijiFranceGermanyGhanaGreeceGrenadaGuatemalaGuyanaHaitiHondurasHong KongHungaryIndiaIndonesiaIranIraqIrelandIsraelItalyJamaicaJapanJordanKazakhstanKenyaKoreaKuwaitLaosLatin AmericaLatviaLebanonLiberiaLithuaniaMalaysiaMexicoMicronesiaMiddle AfricaMoldovaMoroccoNepalNetherlandsNicaraguaNigeriaNorth AmericaNorth MacedoniaNorthern AfricaNorthern EuropeNorwayOceaniaPakistanPanamaPeruPhilippinesPolandPortugalRomaniaRussiaSaudi ArabiaScotlandSenegalSerbiaSierra LeoneSingaporeSomaliaSouth AfricaSouth AmericaSouth Central AsiaSouth Eastern AsiaSouthern EuropeSpainSri LankaSt. Vincent and the GrenadinesSudanSwedenSwitzerlandSyriaTaiwanThailandTrinidad and TobagoTurkeyUgandaUkraineUruguayUzbekistanVenezuelaVietnamWest IndiesWestern AfricaWestern AsiaWestern EuropeYemenZaireZimbabweAzores
Arapaho
Race
Ancestry
AfghanAfricanAlaska NativeAlaskan AthabascanAlbanianAleutAlsatianAmericanApacheArabArapahoArgentineanArmenianAssyrian/Chaldean/SyriacAustrianBahamianBangladeshiBarbadianBasqueBelgianBelizeanBermudanBhutaneseBlackfeetBolivianBrazilianBritishBritish West IndianBulgarianBurmeseCajunCambodianCanadianCape VerdeanCarpatho RusynCelticCentral AmericanCentral American IndianCherokeeCheyenneChickasawChileanChineseChippewaChoctawColombianColvilleComancheCosta RicanCreeCreekCroatianCrowCubanCypriotCzechCzechoslovakianDanishDelawareDominicanDutchDutch West IndianEastern EuropeanEcuadorianEgyptianEnglishEstonianEthiopianEuropeanFijianFilipinoFinnishFrenchFrench American IndianFrench CanadianGermanGerman RussianGhanaianGreekGuamanian/ChamorroGuatemalanGuyaneseHaitianHmongHonduranHopiHoumaHungarianIcelanderIndian (Asian)IndonesianInupiatIranianIraqiIrishIroquoisIsraeliItalianJamaicanJapaneseJordanianKenyanKiowaKoreanLaotianLatvianLebaneseLiberianLithuanianLumbeeLuxembourgerMacedonianMalaysianMalteseMarshalleseMenomineeMexicanMexican American IndianMongolianMoroccanNative HawaiianNavajoNepaleseNew ZealanderNicaraguanNigerianNorthern EuropeanNorwegianOkinawanOsageOttawaPaiutePakistaniPalestinianPanamanianParaguayanPennsylvania GermanPeruvianPimaPolishPortuguesePotawatomiPuebloPuerto RicanPuget Sound SalishRomanianRussianSalvadoranSamoanScandinavianScotch-IrishScottishSeminoleSenegaleseSerbianShoshoneSierra LeoneanSiouxSlavicSlovakSloveneSomaliSouth AfricanSouth AmericanSouth American IndianSoviet UnionSpaniardSpanishSpanish AmericanSpanish American IndianSri LankanSubsaharan AfricanSudaneseSwedishSwissSyrianTaiwaneseThaiTlingit-HaidaTohono O'OdhamTonganTrinidadian and TobagonianTsimshianTurkishU.S. Virgin IslanderUgandanUkrainianUruguayanUteVenezuelanVietnameseWelshWest IndianYakamaYaquiYugoslavianYumanYup'ikZimbabwean
Immigration
NonimmigrantsImmigrantsAfghanistanAfricaAlbaniaArgentinaArmeniaAsiaAustraliaAustriaBahamasBangladeshBarbadosBelarusBelgiumBelizeBoliviaBosnia and HerzegovinaBrazilBulgariaBurma/MyanmarCabo VerdeCambodiaCameroonCanadaCaribbeanCentral AmericaChileChinaColombiaCongoCosta RicaCroatiaCubaCzechoslovakiaDenmarkDominicaDominican RepublicEastern AfricaEastern AsiaEastern EuropeEcuadorEgyptEl SalvadorEnglandEritreaEthiopiaEuropeFijiFranceGermanyGhanaGreeceGrenadaGuatemalaGuyanaHaitiHondurasHong KongHungaryIndiaIndonesiaIranIraqIrelandIsraelItalyJamaicaJapanJordanKazakhstanKenyaKoreaKuwaitLaosLatin AmericaLatviaLebanonLiberiaLithuaniaMalaysiaMexicoMicronesiaMiddle AfricaMoldovaMoroccoNepalNetherlandsNicaraguaNigeriaNorth AmericaNorth MacedoniaNorthern AfricaNorthern EuropeNorwayOceaniaPakistanPanamaPeruPhilippinesPolandPortugalRomaniaRussiaSaudi ArabiaScotlandSenegalSerbiaSierra LeoneSingaporeSomaliaSouth AfricaSouth AmericaSouth Central AsiaSouth Eastern AsiaSouthern EuropeSpainSri LankaSt. Vincent and the GrenadinesSudanSwedenSwitzerlandSyriaTaiwanThailandTrinidad and TobagoTurkeyUgandaUkraineUruguayUzbekistanVenezuelaVietnamWest IndiesWestern AfricaWestern AsiaWestern EuropeYemenZaireZimbabweAzores
In Labor Force | Age 30-34
Income
Poverty
Unemployment
Labor Participation
Family Structure
Vehicle Availability
Education Level
Disability

In Labor Force | Age 30-34 Comparison

Australians

Arapaho

Exceptional
Tragic
85.0%
IN LABOR FORCE | AGE 30-34
92.0/ 100
METRIC RATING
124th/ 347
METRIC RANK
81.5%
IN LABOR FORCE | AGE 30-34
0.0/ 100
METRIC RATING
317th/ 347
METRIC RANK

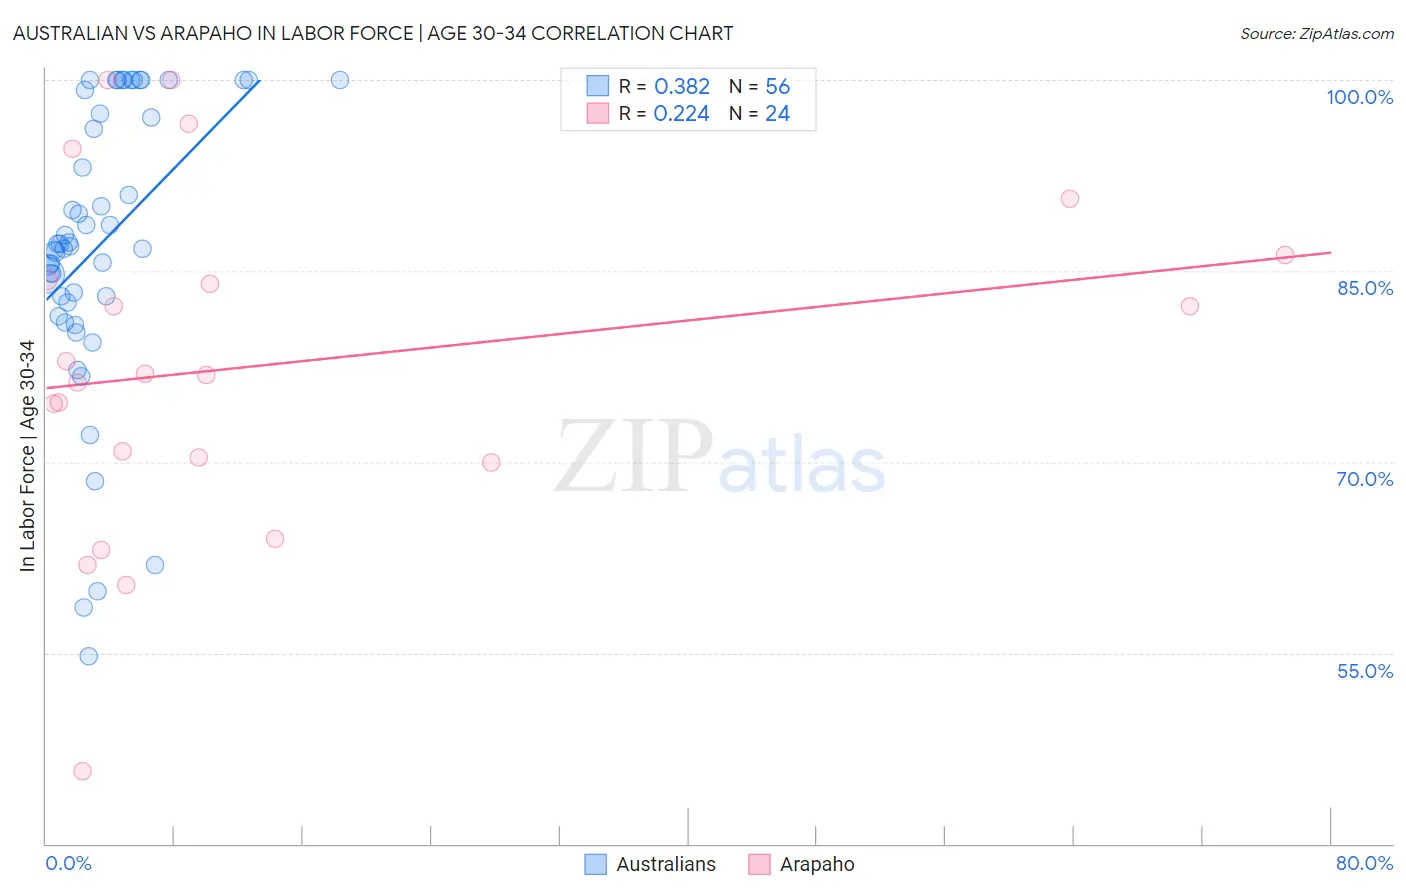
Australian vs Arapaho In Labor Force | Age 30-34 Correlation Chart

The statistical analysis conducted on geographies consisting of 224,058,107 people shows a mild positive correlation between the proportion of Australians and labor force participation rate among population between the ages 30 and 34 in the United States with a correlation coefficient (R) of 0.382 and weighted average of 85.0%. Similarly, the statistical analysis conducted on geographies consisting of 29,773,320 people shows a weak positive correlation between the proportion of Arapaho and labor force participation rate among population between the ages 30 and 34 in the United States with a correlation coefficient (R) of 0.224 and weighted average of 81.5%, a difference of 4.4%.
Australian vs Arapaho In Labor Force | Age 30-34

In Labor Force | Age 30-34 Correlation Summary

MeasurementAustralianArapaho
Minimum54.7%45.7%
Maximum100.0%100.0%
Range45.3%54.3%
Mean87.1%77.7%
Median87.0%76.8%
Interquartile 25% (IQ1)82.8%70.2%
Interquartile 75% (IQ3)98.3%85.3%
Interquartile Range (IQR)15.5%15.1%
Standard Deviation (Sample)11.3%13.5%
Standard Deviation (Population)11.2%13.2%

Similar Demographics by In Labor Force | Age 30-34

Demographics Similar to Australians by In Labor Force | Age 30-34

In terms of in labor force | age 30-34, the demographic groups most similar to Australians are Armenian (85.0%, a difference of 0.0%), Immigrants from Kuwait (85.1%, a difference of 0.010%), Immigrants from Jordan (85.0%, a difference of 0.010%), Austrian (85.0%, a difference of 0.020%), and Immigrants from Southern Europe (85.1%, a difference of 0.030%).
DemographicsRating | RankIn Labor Force | Age 30-34
Immigrants | Denmark
94.3
/100
|
#117
Exceptional
85.1%
Immigrants | Malaysia
94.2
/100
|
#118
Exceptional
85.1%
Asians
93.4
/100
|
#119
Exceptional
85.1%
Immigrants | Southern Europe
93.3
/100
|
#120
Exceptional
85.1%
Immigrants | Egypt
93.2
/100
|
#121
Exceptional
85.1%
Immigrants | Kuwait
92.6
/100
|
#122
Exceptional
85.1%
Armenians
92.2
/100
|
#123
Exceptional
85.0%
Australians
92.0
/100
|
#124
Exceptional
85.0%
Immigrants | Jordan
91.5
/100
|
#125
Exceptional
85.0%
Austrians
90.9
/100
|
#126
Exceptional
85.0%
Slavs
90.7
/100
|
#127
Exceptional
85.0%
Immigrants | Argentina
90.6
/100
|
#128
Exceptional
85.0%
Immigrants | Western Africa
90.2
/100
|
#129
Exceptional
85.0%
Immigrants | Spain
90.0
/100
|
#130
Exceptional
85.0%
Chinese
89.6
/100
|
#131
Excellent
85.0%

Demographics Similar to Arapaho by In Labor Force | Age 30-34

In terms of in labor force | age 30-34, the demographic groups most similar to Arapaho are Immigrants from the Azores (81.5%, a difference of 0.010%), Choctaw (81.4%, a difference of 0.080%), Shoshone (81.4%, a difference of 0.080%), Yaqui (81.4%, a difference of 0.10%), and Cherokee (81.6%, a difference of 0.16%).
DemographicsRating | RankIn Labor Force | Age 30-34
Cajuns
0.0
/100
|
#310
Tragic
82.0%
Chickasaw
0.0
/100
|
#311
Tragic
81.9%
Mexicans
0.0
/100
|
#312
Tragic
81.9%
Iroquois
0.0
/100
|
#313
Tragic
81.9%
Alaskan Athabascans
0.0
/100
|
#314
Tragic
81.7%
Cherokee
0.0
/100
|
#315
Tragic
81.6%
Immigrants | Azores
0.0
/100
|
#316
Tragic
81.5%
Arapaho
0.0
/100
|
#317
Tragic
81.5%
Choctaw
0.0
/100
|
#318
Tragic
81.4%
Shoshone
0.0
/100
|
#319
Tragic
81.4%
Yaqui
0.0
/100
|
#320
Tragic
81.4%
Alaska Natives
0.0
/100
|
#321
Tragic
81.3%
Puerto Ricans
0.0
/100
|
#322
Tragic
81.2%
Paiute
0.0
/100
|
#323
Tragic
81.2%
Cheyenne
0.0
/100
|
#324
Tragic
81.1%