Zip Codes with the Most Immigrants from Peru in Louisiana
RELATED REPORTS & OPTIONS
Peru
Louisiana
Compare Zip Codes
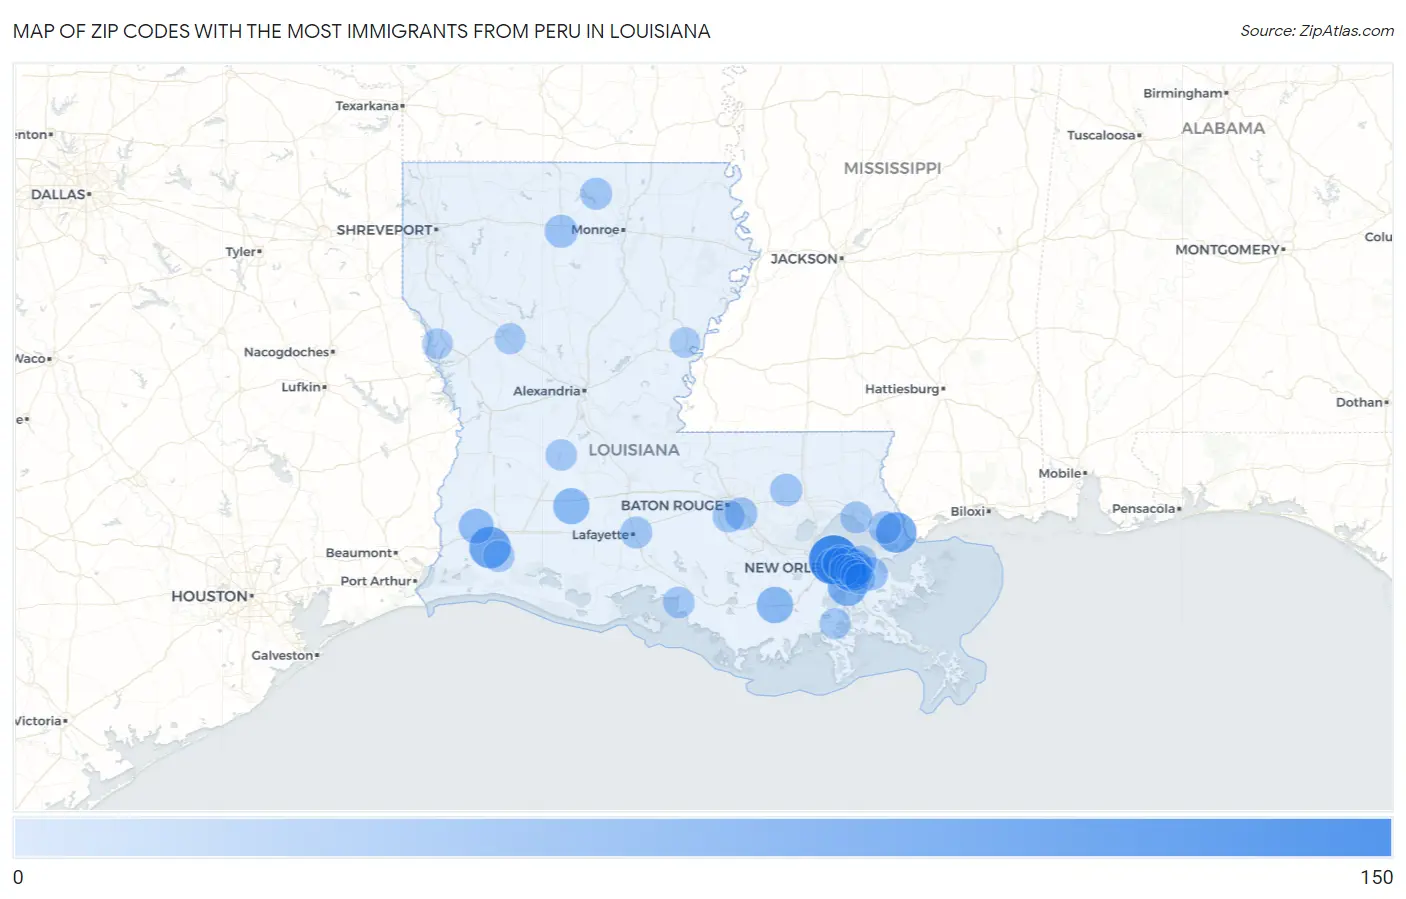
Map of Zip Codes with the Most Immigrants from Peru in Louisiana
0
150
Zip Codes with the Most Immigrants from Peru in Louisiana
| Zip Code | Peru | vs State | vs National | |
| 1. | 70065 | 122 | 880(13.86%)#1 | 461,322(0.03%)#930 |
| 2. | 70605 | 70 | 880(7.95%)#2 | 461,322(0.02%)#1,595 |
| 3. | 70461 | 64 | 880(7.27%)#3 | 461,322(0.01%)#1,725 |
| 4. | 70072 | 57 | 880(6.48%)#4 | 461,322(0.01%)#1,878 |
| 5. | 70119 | 49 | 880(5.57%)#5 | 461,322(0.01%)#2,102 |
| 6. | 70113 | 45 | 880(5.11%)#6 | 461,322(0.01%)#2,238 |
| 7. | 70118 | 44 | 880(5.00%)#7 | 461,322(0.01%)#2,255 |
| 8. | 70359 | 38 | 880(4.32%)#8 | 461,322(0.01%)#2,470 |
| 9. | 70115 | 36 | 880(4.09%)#9 | 461,322(0.01%)#2,526 |
| 10. | 70515 | 36 | 880(4.09%)#10 | 461,322(0.01%)#2,551 |
| 11. | 70062 | 35 | 880(3.98%)#11 | 461,322(0.01%)#2,583 |
| 12. | 70663 | 29 | 880(3.30%)#12 | 461,322(0.01%)#2,839 |
| 13. | 70006 | 28 | 880(3.18%)#13 | 461,322(0.01%)#2,905 |
| 14. | 70005 | 25 | 880(2.84%)#14 | 461,322(0.01%)#3,081 |
| 15. | 70075 | 18 | 880(2.05%)#15 | 461,322(0.00%)#3,583 |
| 16. | 71270 | 17 | 880(1.93%)#16 | 461,322(0.00%)#3,614 |
| 17. | 70003 | 15 | 880(1.70%)#17 | 461,322(0.00%)#3,780 |
| 18. | 70458 | 15 | 880(1.70%)#18 | 461,322(0.00%)#3,781 |
| 19. | 70809 | 14 | 880(1.59%)#19 | 461,322(0.00%)#3,909 |
| 20. | 70820 | 13 | 880(1.48%)#20 | 461,322(0.00%)#4,022 |
| 21. | 70744 | 13 | 880(1.48%)#21 | 461,322(0.00%)#4,048 |
| 22. | 70501 | 10 | 880(1.14%)#22 | 461,322(0.00%)#4,370 |
| 23. | 70448 | 10 | 880(1.14%)#23 | 461,322(0.00%)#4,374 |
| 24. | 71241 | 10 | 880(1.14%)#24 | 461,322(0.00%)#4,431 |
| 25. | 70607 | 8 | 880(0.91%)#25 | 461,322(0.00%)#4,614 |
| 26. | 70117 | 8 | 880(0.91%)#26 | 461,322(0.00%)#4,619 |
| 27. | 70538 | 8 | 880(0.91%)#27 | 461,322(0.00%)#4,652 |
| 28. | 71463 | 7 | 880(0.80%)#28 | 461,322(0.00%)#4,792 |
| 29. | 70126 | 6 | 880(0.68%)#29 | 461,322(0.00%)#4,854 |
| 30. | 70125 | 6 | 880(0.68%)#30 | 461,322(0.00%)#4,884 |
| 31. | 70130 | 5 | 880(0.57%)#31 | 461,322(0.00%)#4,990 |
| 32. | 70345 | 5 | 880(0.57%)#32 | 461,322(0.00%)#5,003 |
| 33. | 71457 | 4 | 880(0.45%)#33 | 461,322(0.00%)#5,066 |
| 34. | 70121 | 4 | 880(0.45%)#34 | 461,322(0.00%)#5,104 |
| 35. | 70053 | 2 | 880(0.23%)#35 | 461,322(0.00%)#5,282 |
| 36. | 71462 | 2 | 880(0.23%)#36 | 461,322(0.00%)#5,337 |
| 37. | 70056 | 1 | 880(0.11%)#37 | 461,322(0.00%)#5,357 |
| 38. | 71334 | 1 | 880(0.11%)#38 | 461,322(0.00%)#5,382 |
Common Questions
What are the Top 10 Zip Codes with the Most Immigrants from Peru in Louisiana?
Top 10 Zip Codes with the Most Immigrants from Peru in Louisiana are:
What zip code has the Most Immigrants from Peru in Louisiana?
70065 has the Most Immigrants from Peru in Louisiana with 122.
What is the Total Immigrants from Peru in the State of Louisiana?
Total Immigrants from Peru in Louisiana is 880.
What is the Total Immigrants from Peru in the United States?
Total Immigrants from Peru in the United States is 461,322.