Zip Codes with the Highest Percentage of Population Employed in Architecture & Engineering in New Orleans, LA

RELATED REPORTS & OPTIONS

Architecture & Engineering
Population
Families and Households
Female Fertility
Female Fertility (Unmarried)
Race (Community Size)
Race (Percentage)
Ancestry (Community Size)
AfricanAlaska NativeAlbanianAlsatianAmericanApacheArabArgentineanArmenianAustralianAustrianBarbadianBasqueBelgianBelizeanBhutaneseBlackfeetBolivianBrazilianBritishBritish West IndianBulgarianBurmeseCajunCanadianCelticCentral AmericanCentral American IndianCherokeeChickasawChileanChippewaChoctawColombianCosta RicanCreekCroatianCubanCzechCzechoslovakianDanishDominicanDutchEastern EuropeanEcuadorianEgyptianEnglishEstonianEthiopianEuropeanFilipinoFinnishFrenchFrench CanadianGermanGhanaianGreekGuamanian / ChamorroGuatemalanGuyaneseHaitianHonduranHoumaHungarianIndian (Asian)IranianIrishIroquoisIsraeliItalianJamaicanJapaneseKenyanKoreanLaotianLatvianLebaneseLithuanianLuxembourgerMexicanMexican American IndianMongolianMoroccanNative HawaiianNavajoNicaraguanNigerianNorthern EuropeanNorwegianPakistaniPalestinianPanamanianParaguayanPennsylvania GermanPeruvianPolishPortuguesePuerto RicanRomanianRussianSalvadoranSamoanScandinavianScotch-IrishScottishSeminoleSenegaleseSerbianSiouxSlavicSlovakSloveneSouth AfricanSouth AmericanSouth American IndianSpaniardSpanishSri LankanSubsaharan AfricanSwedishSwissSyrianThaiTrinidadian and TobagonianTurkishUgandanUkrainianUruguayanVenezuelanVietnameseWelshWest IndianYugoslavian
Ancestry (Percentage)
AfricanAlaska NativeAlbanianAlsatianAmericanApacheArabArgentineanArmenianAustralianAustrianBarbadianBasqueBelgianBelizeanBhutaneseBlackfeetBolivianBrazilianBritishBritish West IndianBulgarianBurmeseCajunCanadianCelticCentral AmericanCentral American IndianCherokeeChickasawChileanChippewaChoctawColombianCosta RicanCreekCroatianCubanCzechCzechoslovakianDanishDominicanDutchEastern EuropeanEcuadorianEgyptianEnglishEstonianEthiopianEuropeanFilipinoFinnishFrenchFrench CanadianGermanGhanaianGreekGuamanian / ChamorroGuatemalanGuyaneseHaitianHonduranHoumaHungarianIndian (Asian)IranianIrishIroquoisIsraeliItalianJamaicanJapaneseKenyanKoreanLaotianLatvianLebaneseLithuanianLuxembourgerMexicanMexican American IndianMongolianMoroccanNative HawaiianNavajoNicaraguanNigerianNorthern EuropeanNorwegianPakistaniPalestinianPanamanianParaguayanPennsylvania GermanPeruvianPolishPortuguesePuerto RicanRomanianRussianSalvadoranSamoanScandinavianScotch-IrishScottishSeminoleSenegaleseSerbianSiouxSlavicSlovakSloveneSouth AfricanSouth AmericanSouth American IndianSpaniardSpanishSri LankanSubsaharan AfricanSwedishSwissSyrianThaiTrinidadian and TobagonianTurkishUgandanUkrainianUruguayanVenezuelanVietnameseWelshWest IndianYugoslavian
Immigrant Origin (Total)
AfricaAlbaniaArgentinaAsiaAustraliaAustriaBangladeshBarbadosBelgiumBelizeBoliviaBrazilBulgariaCambodiaCameroonCanadaCaribbeanCentral AmericaChileChinaColombiaCosta RicaCubaCzechoslovakiaDominicaDominican RepublicEastern AfricaEastern AsiaEastern EuropeEcuadorEl SalvadorEnglandEritreaEthiopiaEuropeFranceGermanyGreeceGuatemalaGuyanaHaitiHondurasHong KongHungaryIndiaIndonesiaIranIraqIrelandIsraelItalyJamaicaJapanKenyaKoreaLaosLatin AmericaLebanonMalaysiaMexicoMiddle AfricaNetherlandsNicaraguaNigeriaNorthern AfricaNorthern EuropeNorwayOceaniaPakistanPanamaPeruPhilippinesPolandRomaniaRussiaSaudi ArabiaScotlandSenegalSouth AfricaSouth AmericaSouth Central AsiaSouth Eastern AsiaSouthern EuropeSpainSwedenSwitzerlandSyriaTaiwanThailandTrinidad and TobagoTurkeyUgandaUkraineVenezuelaVietnamWest IndiesWestern AfricaWestern AsiaWestern Europe
Immigrant Origin (Percentage)
AfricaAlbaniaArgentinaAsiaAustraliaAustriaBangladeshBarbadosBelgiumBelizeBoliviaBrazilBulgariaCambodiaCameroonCanadaCaribbeanCentral AmericaChileChinaColombiaCosta RicaCubaCzechoslovakiaDominicaDominican RepublicEastern AfricaEastern AsiaEastern EuropeEcuadorEl SalvadorEnglandEritreaEthiopiaEuropeFranceGermanyGreeceGuatemalaGuyanaHaitiHondurasHong KongHungaryIndiaIndonesiaIranIraqIrelandIsraelItalyJamaicaJapanKenyaKoreaLaosLatin AmericaLebanonMalaysiaMexicoMiddle AfricaNetherlandsNicaraguaNigeriaNorthern AfricaNorthern EuropeNorwayOceaniaPakistanPanamaPeruPhilippinesPolandRomaniaRussiaSaudi ArabiaScotlandSenegalSouth AfricaSouth AmericaSouth Central AsiaSouth Eastern AsiaSouthern EuropeSpainSwedenSwitzerlandSyriaTaiwanThailandTrinidad and TobagoTurkeyUgandaUkraineVenezuelaVietnamWest IndiesWestern AfricaWestern AsiaWestern Europe
Income
Income (Families)
Income (Households)
Poverty
Poverty (Families)
Unemployment
Employment Occupations
Employment Industries
Employer Class
Commute Time
Commute Means
School Enrollment
Education by Degree Field
Occupancy
Finances
Physical Characteristics
New Orleans
Compare Zip Codes
Comparison Subject

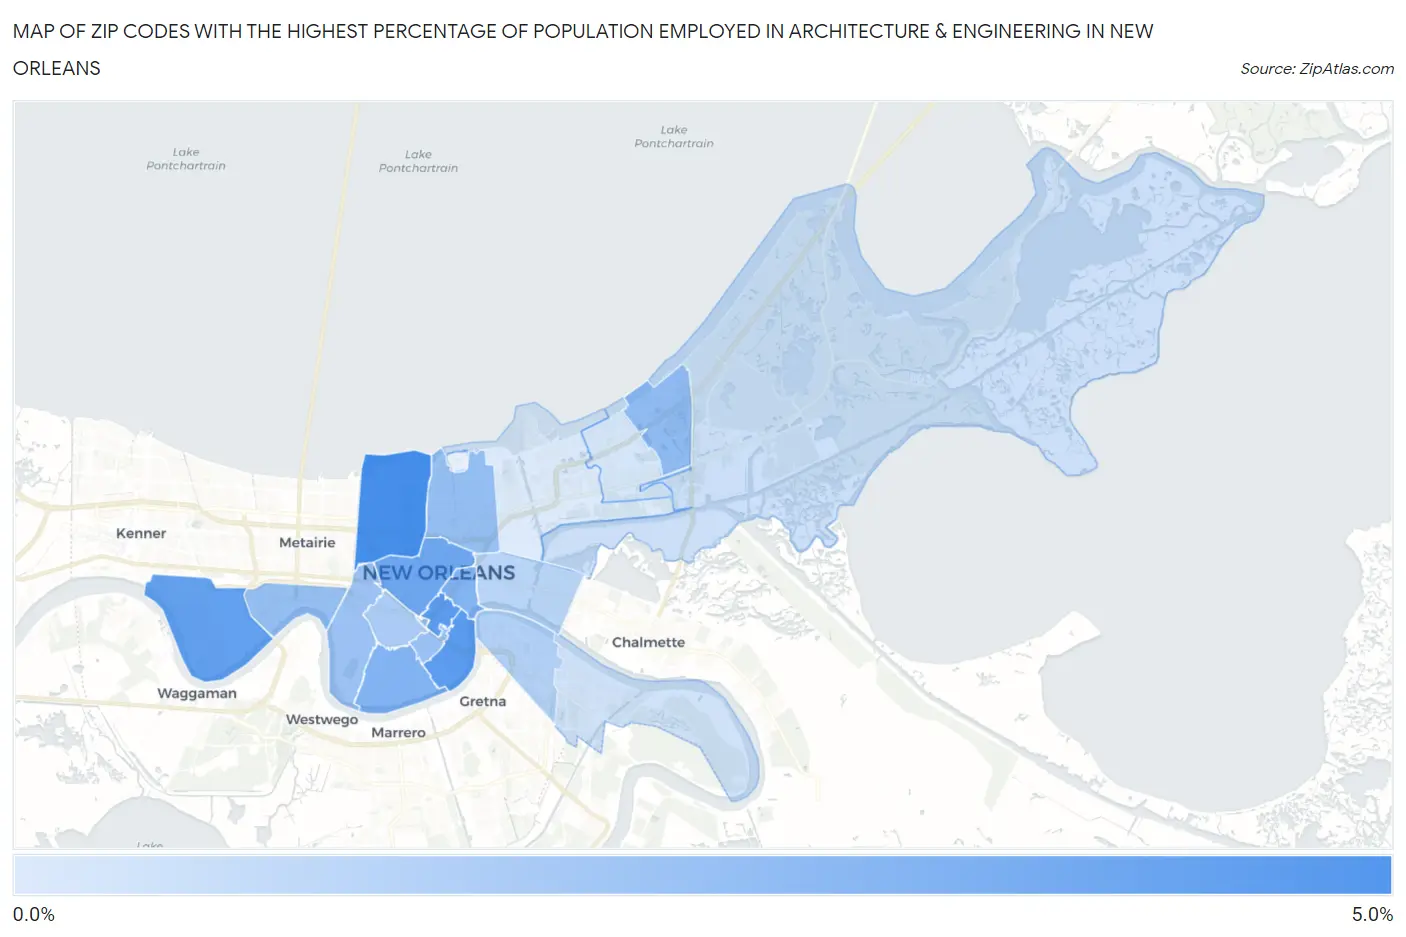
Map of Zip Codes with the Highest Percentage of Population Employed in Architecture & Engineering in New Orleans

0.0%
5.0%
Zip Codes with the Highest Percentage of Population Employed in Architecture & Engineering in New Orleans Map

Zip Codes with the Highest Percentage of Population Employed in Architecture & Engineering in New Orleans, LA

Zip Code % Employed vs State vs National
1.701244.1%1.9%(+2.12)#322.1%(+1.91)#2,688
2.701123.6%1.9%(+1.66)#472.1%(+1.45)#3,516
3.701303.6%1.9%(+1.63)#482.1%(+1.42)#3,559
4.701233.4%1.9%(+1.45)#532.1%(+1.24)#3,975
5.701193.1%1.9%(+1.16)#632.1%(+0.954)#4,736
6.701152.6%1.9%(+0.679)#842.1%(+0.471)#6,490
7.701162.6%1.9%(+0.666)#852.1%(+0.458)#6,550
8.701282.3%1.9%(+0.321)#1062.1%(+0.113)#8,138
9.701212.1%1.9%(+0.195)#1152.1%(-0.013)#8,826
10.701222.1%1.9%(+0.186)#1172.1%(-0.022)#8,887
11.701182.0%1.9%(+0.087)#1232.1%(-0.121)#9,430
12.701132.0%1.9%(+0.056)#1272.1%(-0.152)#9,625
13.701251.6%1.9%(-0.320)#1602.1%(-0.528)#12,042
14.701141.4%1.9%(-0.529)#1772.1%(-0.737)#13,500
15.701171.2%1.9%(-0.702)#1922.1%(-0.910)#14,759
16.701290.80%1.9%(-1.15)#2392.1%(-1.35)#18,169
17.701310.71%1.9%(-1.23)#2482.1%(-1.44)#18,841
18.701270.60%1.9%(-1.34)#2612.1%(-1.55)#19,591
19.701260.42%1.9%(-1.52)#2832.1%(-1.73)#20,834

Common Questions

What are the Top 10 Zip Codes with the Highest Percentage of Population Employed in Architecture & Engineering in New Orleans, LA?
Top 10 Zip Codes with the Highest Percentage of Population Employed in Architecture & Engineering in New Orleans, LA are:
#1
4.1%
#2
3.6%
#3
3.6%
#4
3.4%
#5
3.1%
#6
2.6%
#7
2.6%
#8
2.3%
#9
2.1%
#10
2.1%
What zip code has the Highest Percentage of Population Employed in Architecture & Engineering in New Orleans, LA?
70124 has the Highest Percentage of Population Employed in Architecture & Engineering in New Orleans, LA with 4.1%.
What is the Percentage of Population Employed in Architecture & Engineering in New Orleans, LA?
Percentage of Population Employed in Architecture & Engineering in New Orleans is 2.0%.
What is the Percentage of Population Employed in Architecture & Engineering in Louisiana?
Percentage of Population Employed in Architecture & Engineering in Louisiana is 1.9%.
What is the Percentage of Population Employed in Architecture & Engineering in the United States?
Percentage of Population Employed in Architecture & Engineering in the United States is 2.1%.