Zip Codes with the Highest Percentage of Population with a Degree in Liberal Arts and History in Monroe, LA
RELATED REPORTS & OPTIONS
Liberal Arts and History
Monroe
Compare Zip Codes
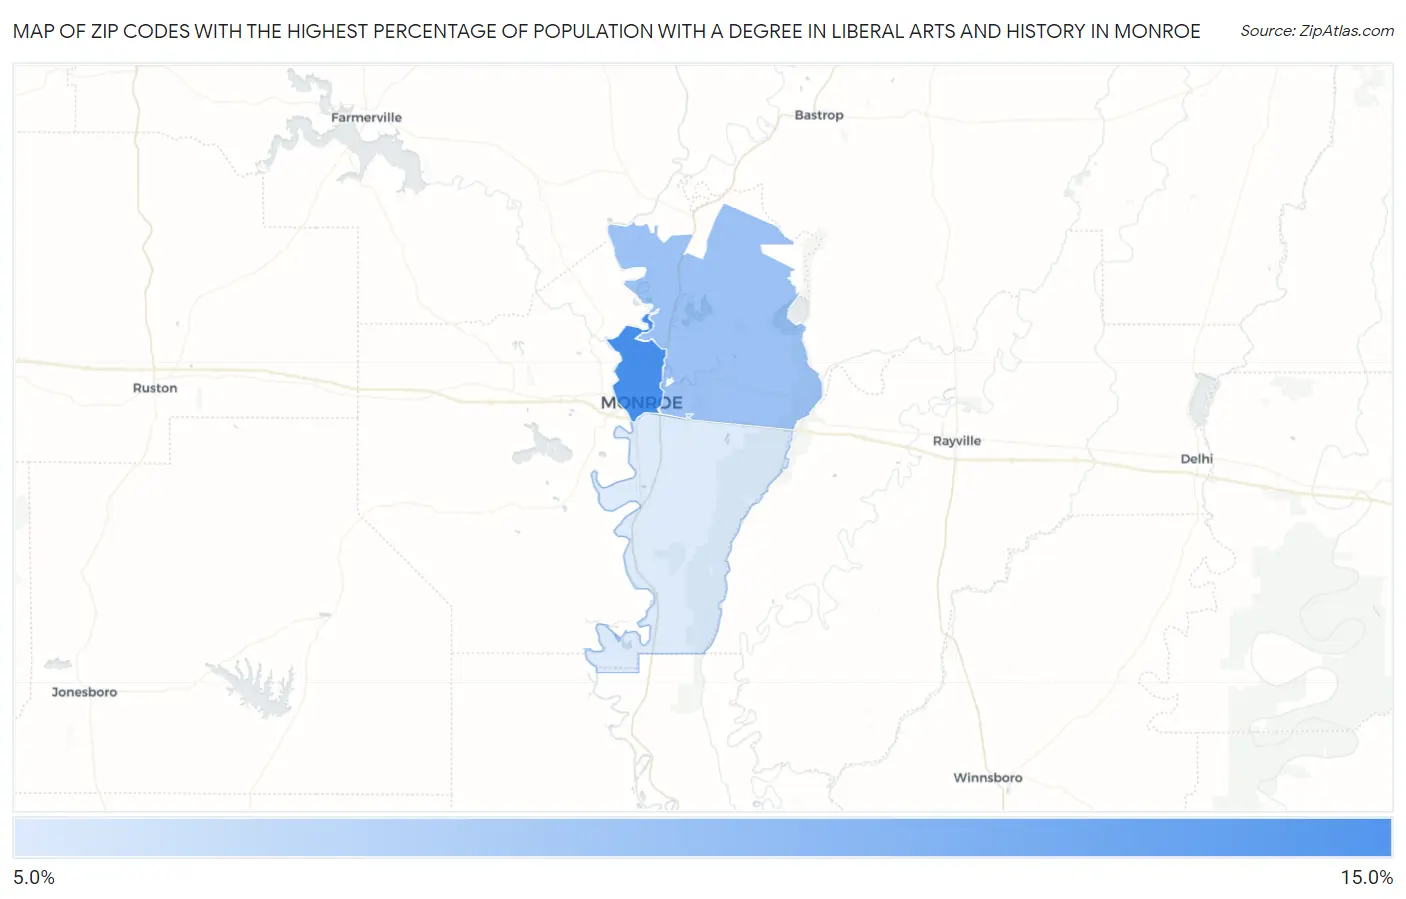
Map of Zip Codes with the Highest Percentage of Population with a Degree in Liberal Arts and History in Monroe
0.0%
15.0%
Zip Codes with the Highest Percentage of Population with a Degree in Liberal Arts and History in Monroe, LA
| Zip Code | % Graduates | vs State | vs National | |
| 1. | 71201 | 10.1% | 7.4%(+2.69)#113 | 4.9%(+5.27)#3,036 |
| 2. | 71203 | 7.6% | 7.4%(+0.139)#181 | 4.9%(+2.71)#5,462 |
| 3. | 71202 | 5.7% | 7.4%(-1.75)#249 | 4.9%(+0.829)#9,305 |
1
Common Questions
What are the Top Zip Codes with the Highest Percentage of Population with a Degree in Liberal Arts and History in Monroe, LA?
Top Zip Codes with the Highest Percentage of Population with a Degree in Liberal Arts and History in Monroe, LA are:
What zip code has the Highest Percentage of Population with a Degree in Liberal Arts and History in Monroe, LA?
71201 has the Highest Percentage of Population with a Degree in Liberal Arts and History in Monroe, LA with 10.1%.
What is the Percentage of Population with a Degree in Liberal Arts and History in Monroe, LA?
Percentage of Population with a Degree in Liberal Arts and History in Monroe is 9.2%.
What is the Percentage of Population with a Degree in Liberal Arts and History in Louisiana?
Percentage of Population with a Degree in Liberal Arts and History in Louisiana is 7.4%.
What is the Percentage of Population with a Degree in Liberal Arts and History in the United States?
Percentage of Population with a Degree in Liberal Arts and History in the United States is 4.9%.