Zip Codes with the Highest Percentage of Private Company Employees in Monroe, LA
RELATED REPORTS & OPTIONS
Private Company Employees
Monroe
Compare Zip Codes
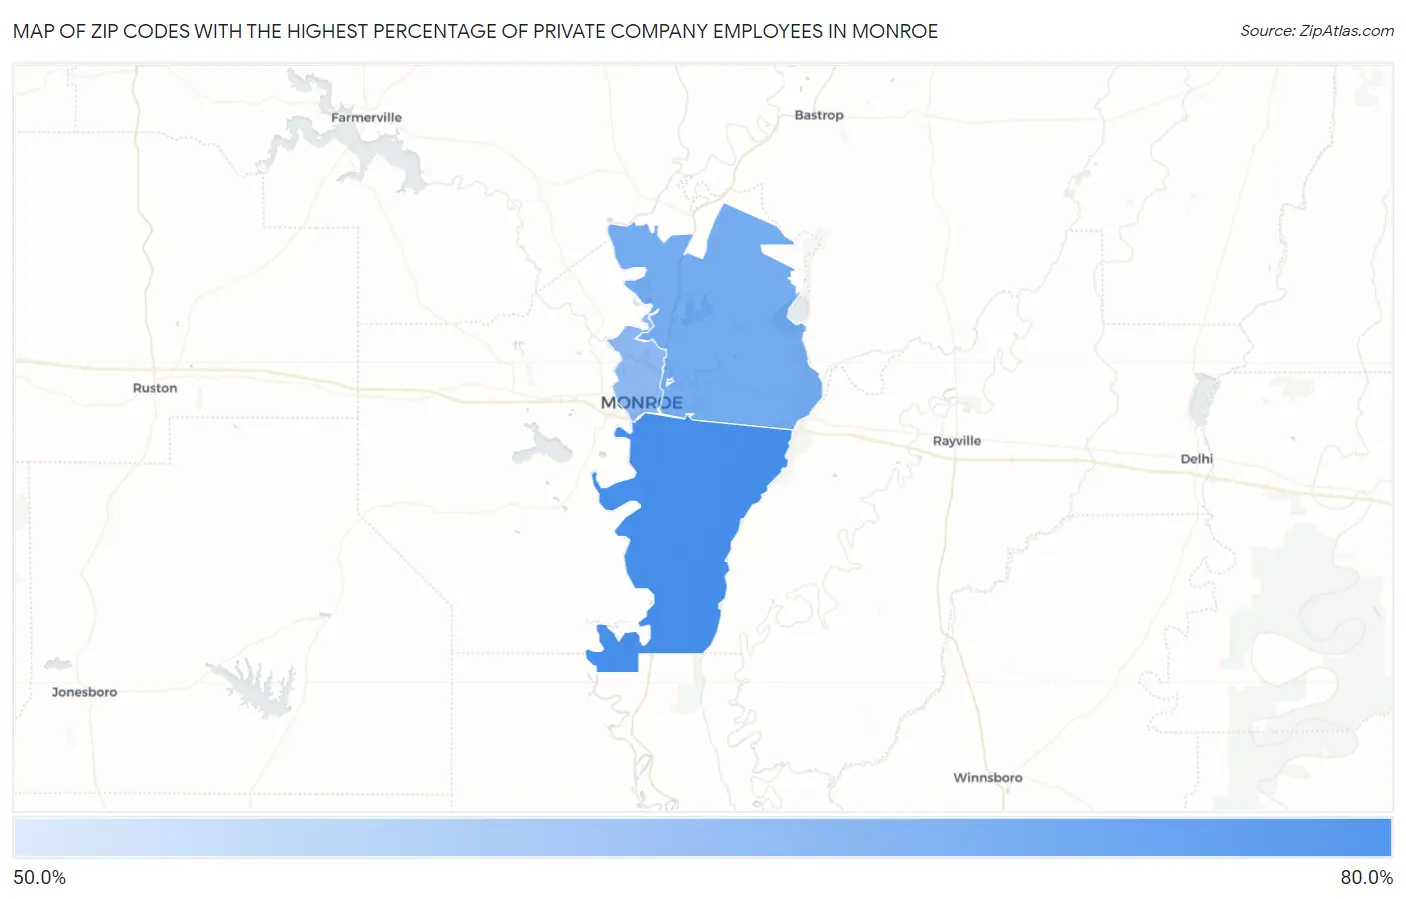
Map of Zip Codes with the Highest Percentage of Private Company Employees in Monroe
0.0%
80.0%
Zip Codes with the Highest Percentage of Private Company Employees in Monroe, LA
| Zip Code | % Private Company Employees | vs State | vs National | |
| 1. | 71202 | 72.1% | 66.4%(+5.74)#139 | 66.9%(+5.26)#7,652 |
| 2. | 71203 | 67.9% | 66.4%(+1.46)#244 | 66.9%(+0.984)#13,248 |
| 3. | 71201 | 65.8% | 66.4%(-0.602)#291 | 66.9%(-1.08)#15,963 |
| 4. | 71209 | 58.5% | 66.4%(-7.91)#423 | 66.9%(-8.39)#23,702 |
1
Common Questions
What are the Top 3 Zip Codes with the Highest Percentage of Private Company Employees in Monroe, LA?
Top 3 Zip Codes with the Highest Percentage of Private Company Employees in Monroe, LA are:
What zip code has the Highest Percentage of Private Company Employees in Monroe, LA?
71202 has the Highest Percentage of Private Company Employees in Monroe, LA with 72.1%.
What is the Percentage of Private Company Employees in Monroe, LA?
Percentage of Private Company Employees in Monroe is 69.0%.
What is the Percentage of Private Company Employees in Louisiana?
Percentage of Private Company Employees in Louisiana is 66.4%.
What is the Percentage of Private Company Employees in the United States?
Percentage of Private Company Employees in the United States is 66.9%.