Zip Codes with the Highest Percentage of Population Employed in Legal Services & Support in Bossier City, LA
RELATED REPORTS & OPTIONS
Legal Services & Support
Bossier City
Compare Zip Codes
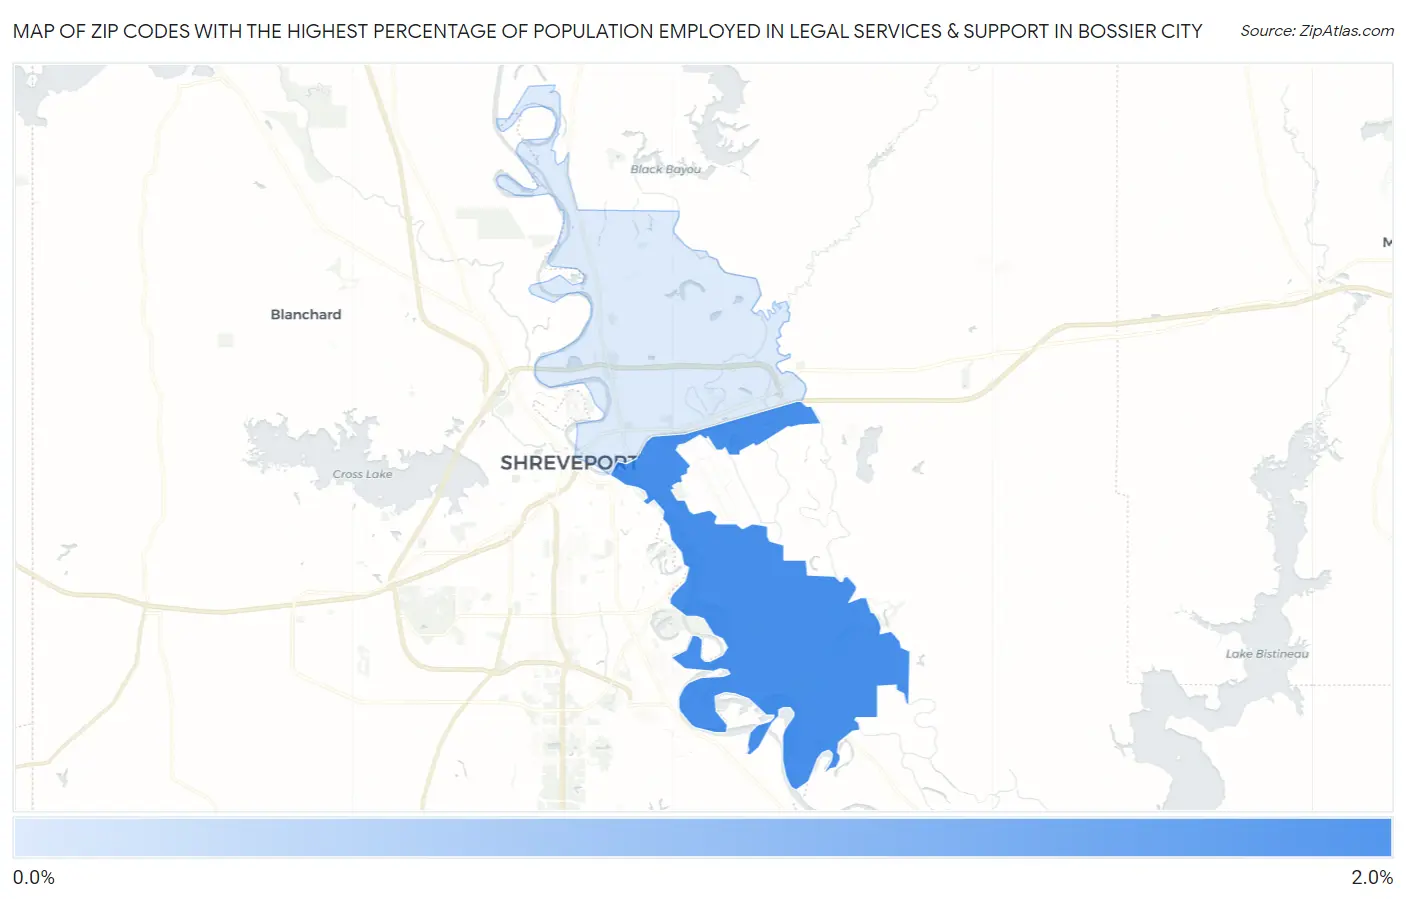
Map of Zip Codes with the Highest Percentage of Population Employed in Legal Services & Support in Bossier City
0.0%
2.0%
Zip Codes with the Highest Percentage of Population Employed in Legal Services & Support in Bossier City, LA
| Zip Code | % Employed | vs State | vs National | |
| 1. | 71112 | 1.6% | 1.3%(+0.261)#91 | 1.2%(+0.408)#4,702 |
| 2. | 71111 | 0.92% | 1.3%(-0.409)#146 | 1.2%(-0.262)#8,413 |
1
Common Questions
What are the Top Zip Codes with the Highest Percentage of Population Employed in Legal Services & Support in Bossier City, LA?
Top Zip Codes with the Highest Percentage of Population Employed in Legal Services & Support in Bossier City, LA are:
What zip code has the Highest Percentage of Population Employed in Legal Services & Support in Bossier City, LA?
71112 has the Highest Percentage of Population Employed in Legal Services & Support in Bossier City, LA with 1.6%.
What is the Percentage of Population Employed in Legal Services & Support in Bossier City, LA?
Percentage of Population Employed in Legal Services & Support in Bossier City is 1.3%.
What is the Percentage of Population Employed in Legal Services & Support in Louisiana?
Percentage of Population Employed in Legal Services & Support in Louisiana is 1.3%.
What is the Percentage of Population Employed in Legal Services & Support in the United States?
Percentage of Population Employed in Legal Services & Support in the United States is 1.2%.