Zip Codes with the Highest Percentage of Population Employed in Legal Services & Support in Covington, LA
RELATED REPORTS & OPTIONS
Legal Services & Support
Covington
Compare Zip Codes
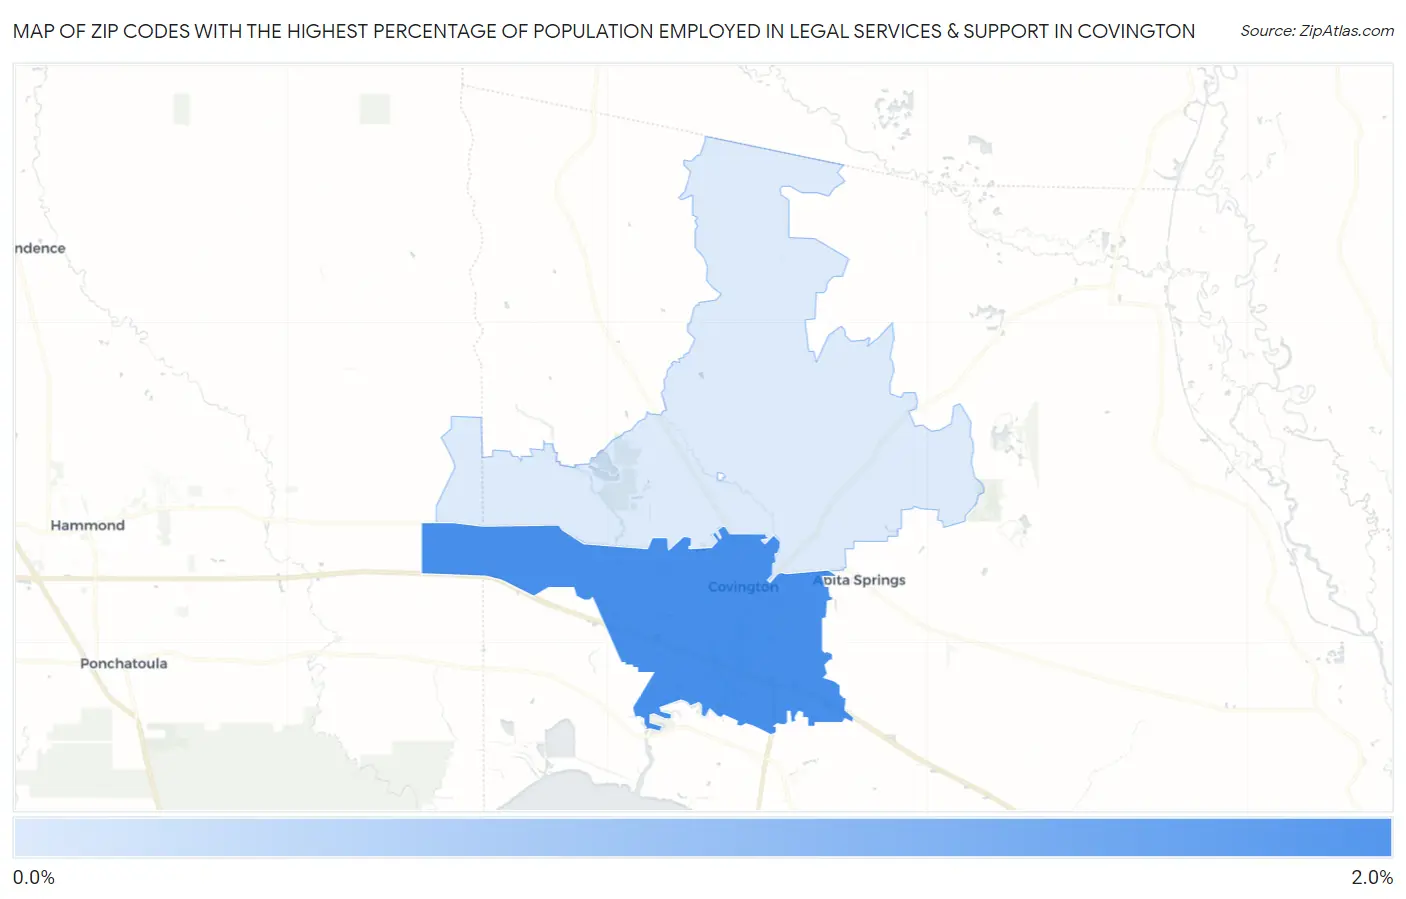
Map of Zip Codes with the Highest Percentage of Population Employed in Legal Services & Support in Covington
0.0%
2.0%
Zip Codes with the Highest Percentage of Population Employed in Legal Services & Support in Covington, LA
| Zip Code | % Employed | vs State | vs National | |
| 1. | 70433 | 1.8% | 1.3%(+0.471)#73 | 1.2%(+0.618)#3,998 |
| 2. | 70435 | 0.27% | 1.3%(-1.06)#238 | 1.2%(-0.911)#15,354 |
1
Common Questions
What are the Top Zip Codes with the Highest Percentage of Population Employed in Legal Services & Support in Covington, LA?
Top Zip Codes with the Highest Percentage of Population Employed in Legal Services & Support in Covington, LA are:
What zip code has the Highest Percentage of Population Employed in Legal Services & Support in Covington, LA?
70433 has the Highest Percentage of Population Employed in Legal Services & Support in Covington, LA with 1.8%.
What is the Percentage of Population Employed in Legal Services & Support in Covington, LA?
Percentage of Population Employed in Legal Services & Support in Covington is 1.9%.
What is the Percentage of Population Employed in Legal Services & Support in Louisiana?
Percentage of Population Employed in Legal Services & Support in Louisiana is 1.3%.
What is the Percentage of Population Employed in Legal Services & Support in the United States?
Percentage of Population Employed in Legal Services & Support in the United States is 1.2%.