Zip Codes with the Highest Percentage of Population Employed in Office & Administration in Bossier City, LA
RELATED REPORTS & OPTIONS
Office & Administration
Bossier City
Compare Zip Codes
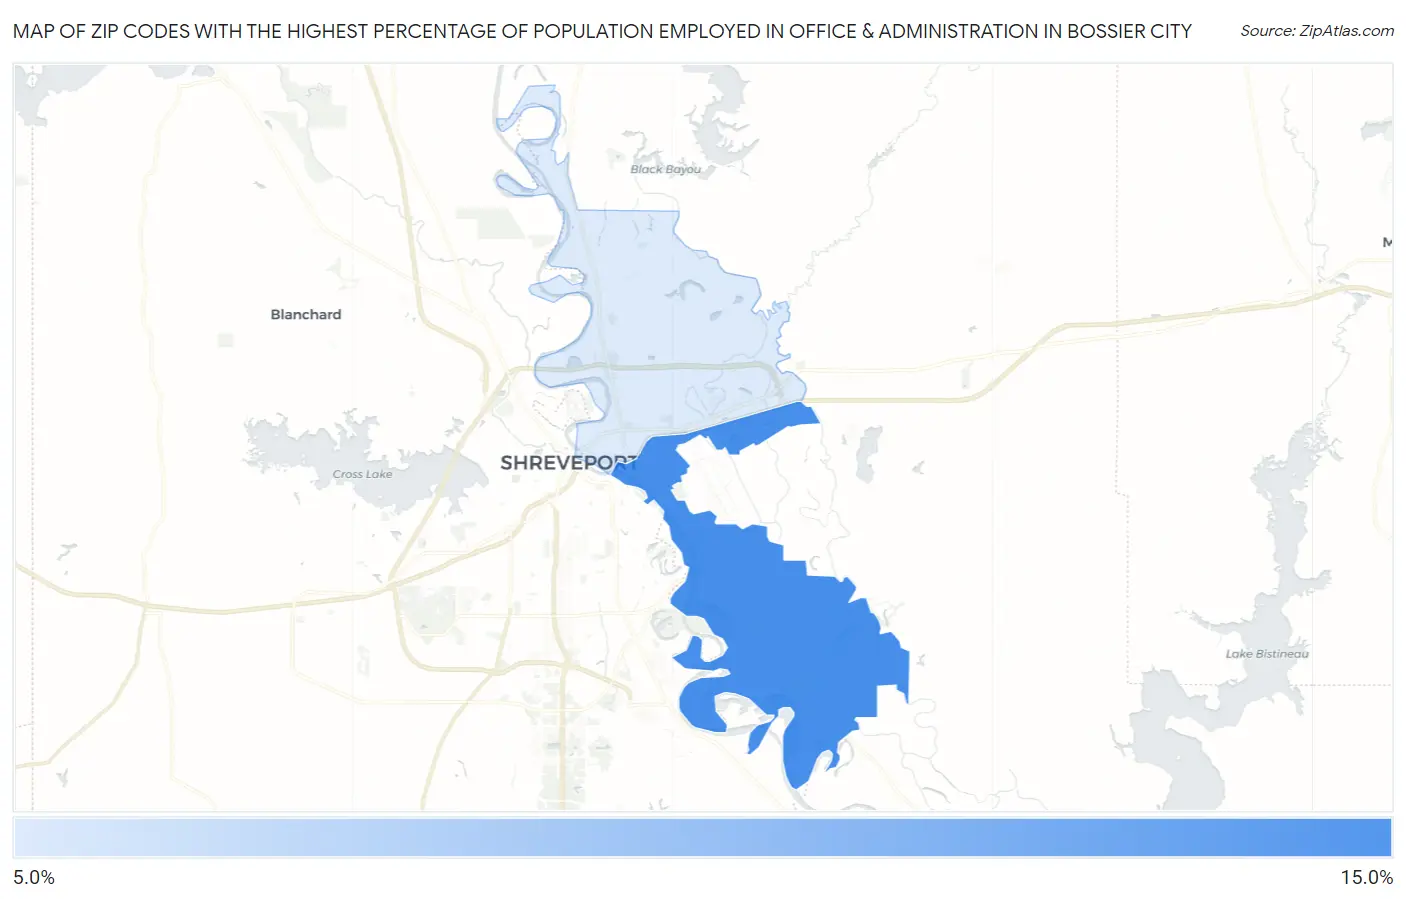
Map of Zip Codes with the Highest Percentage of Population Employed in Office & Administration in Bossier City
0.0%
15.0%
Zip Codes with the Highest Percentage of Population Employed in Office & Administration in Bossier City, LA
| Zip Code | % Employed | vs State | vs National | |
| 1. | 71112 | 10.3% | 10.6%(-0.318)#246 | 10.9%(-0.573)#16,219 |
| 2. | 71111 | 9.7% | 10.6%(-0.899)#273 | 10.9%(-1.15)#18,061 |
1
Common Questions
What are the Top Zip Codes with the Highest Percentage of Population Employed in Office & Administration in Bossier City, LA?
Top Zip Codes with the Highest Percentage of Population Employed in Office & Administration in Bossier City, LA are:
What zip code has the Highest Percentage of Population Employed in Office & Administration in Bossier City, LA?
71112 has the Highest Percentage of Population Employed in Office & Administration in Bossier City, LA with 10.3%.
What is the Percentage of Population Employed in Office & Administration in Bossier City, LA?
Percentage of Population Employed in Office & Administration in Bossier City is 10.7%.
What is the Percentage of Population Employed in Office & Administration in Louisiana?
Percentage of Population Employed in Office & Administration in Louisiana is 10.6%.
What is the Percentage of Population Employed in Office & Administration in the United States?
Percentage of Population Employed in Office & Administration in the United States is 10.9%.