Yuman vs Czechoslovakian Median Household Income
COMPARE
Yuman
Czechoslovakian
Median Household Income
Median Household Income Comparison
Yuman
Czechoslovakians
$68,743
MEDIAN HOUSEHOLD INCOME
0.0/ 100
METRIC RATING
326th/ 347
METRIC RANK
$84,965
MEDIAN HOUSEHOLD INCOME
47.8/ 100
METRIC RATING
178th/ 347
METRIC RANK
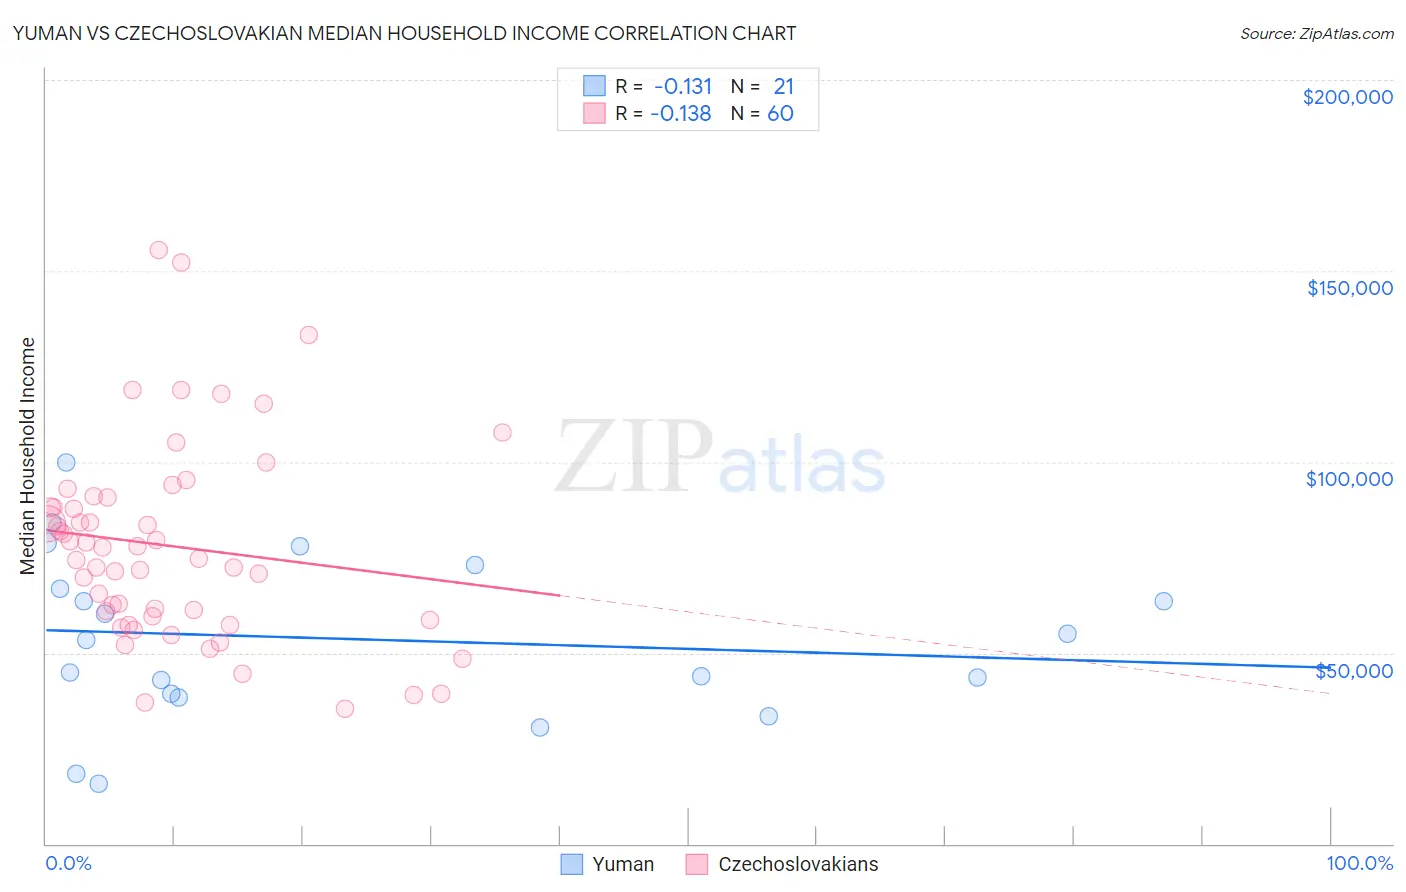
Yuman vs Czechoslovakian Median Household Income Correlation Chart
The statistical analysis conducted on geographies consisting of 40,662,869 people shows a poor negative correlation between the proportion of Yuman and median household income in the United States with a correlation coefficient (R) of -0.131 and weighted average of $68,743. Similarly, the statistical analysis conducted on geographies consisting of 368,473,547 people shows a poor negative correlation between the proportion of Czechoslovakians and median household income in the United States with a correlation coefficient (R) of -0.138 and weighted average of $84,965, a difference of 23.6%.
Median Household Income Correlation Summary
| Measurement | Yuman | Czechoslovakian |
| Minimum | $15,625 | $35,250 |
| Maximum | $99,695 | $155,633 |
| Range | $84,070 | $120,383 |
| Mean | $53,635 | $77,955 |
| Median | $53,295 | $76,068 |
| Interquartile 25% (IQ1) | $38,762 | $59,148 |
| Interquartile 75% (IQ3) | $69,936 | $89,491 |
| Interquartile Range (IQR) | $31,174 | $30,343 |
| Standard Deviation (Sample) | $21,822 | $26,040 |
| Standard Deviation (Population) | $21,296 | $25,822 |
Similar Demographics by Median Household Income
Demographics Similar to Yuman by Median Household Income
In terms of median household income, the demographic groups most similar to Yuman are Immigrants from Cuba ($68,461, a difference of 0.41%), Menominee ($68,423, a difference of 0.47%), Dutch West Indian ($68,412, a difference of 0.48%), Seminole ($69,420, a difference of 0.98%), and Arapaho ($67,965, a difference of 1.1%).
| Demographics | Rating | Rank | Median Household Income |
| Immigrants | Dominican Republic | 0.0 /100 | #319 | Tragic $70,208 |
| Colville | 0.0 /100 | #320 | Tragic $70,094 |
| Chickasaw | 0.0 /100 | #321 | Tragic $70,005 |
| Choctaw | 0.0 /100 | #322 | Tragic $69,947 |
| Bahamians | 0.0 /100 | #323 | Tragic $69,726 |
| Yup'ik | 0.0 /100 | #324 | Tragic $69,695 |
| Seminole | 0.0 /100 | #325 | Tragic $69,420 |
| Yuman | 0.0 /100 | #326 | Tragic $68,743 |
| Immigrants | Cuba | 0.0 /100 | #327 | Tragic $68,461 |
| Menominee | 0.0 /100 | #328 | Tragic $68,423 |
| Dutch West Indians | 0.0 /100 | #329 | Tragic $68,412 |
| Arapaho | 0.0 /100 | #330 | Tragic $67,965 |
| Natives/Alaskans | 0.0 /100 | #331 | Tragic $67,879 |
| Sioux | 0.0 /100 | #332 | Tragic $67,792 |
| Creek | 0.0 /100 | #333 | Tragic $67,715 |
Demographics Similar to Czechoslovakians by Median Household Income
In terms of median household income, the demographic groups most similar to Czechoslovakians are English ($84,915, a difference of 0.060%), Immigrants from Eritrea ($85,025, a difference of 0.070%), Immigrants from Costa Rica ($85,054, a difference of 0.10%), Alsatian ($85,053, a difference of 0.10%), and Scottish ($85,101, a difference of 0.16%).
| Demographics | Rating | Rank | Median Household Income |
| Immigrants | South America | 58.1 /100 | #171 | Average $85,611 |
| Slovenes | 57.4 /100 | #172 | Average $85,562 |
| Immigrants | Cameroon | 53.4 /100 | #173 | Average $85,314 |
| Scottish | 50.0 /100 | #174 | Average $85,101 |
| Immigrants | Costa Rica | 49.2 /100 | #175 | Average $85,054 |
| Alsatians | 49.2 /100 | #176 | Average $85,053 |
| Immigrants | Eritrea | 48.8 /100 | #177 | Average $85,025 |
| Czechoslovakians | 47.8 /100 | #178 | Average $84,965 |
| English | 47.0 /100 | #179 | Average $84,915 |
| Immigrants | Portugal | 44.2 /100 | #180 | Average $84,740 |
| Hawaiians | 44.1 /100 | #181 | Average $84,729 |
| Uruguayans | 43.5 /100 | #182 | Average $84,691 |
| Spaniards | 42.7 /100 | #183 | Average $84,644 |
| Immigrants | Eastern Africa | 37.4 /100 | #184 | Fair $84,299 |
| Kenyans | 34.2 /100 | #185 | Fair $84,085 |