Yaqui vs Immigrants from Ecuador Median Male Earnings
COMPARE
Yaqui
Immigrants from Ecuador
Median Male Earnings
Median Male Earnings Comparison
Yaqui
Immigrants from Ecuador
$46,777
MEDIAN MALE EARNINGS
0.1/ 100
METRIC RATING
303rd/ 347
METRIC RANK
$50,474
MEDIAN MALE EARNINGS
1.9/ 100
METRIC RATING
246th/ 347
METRIC RANK
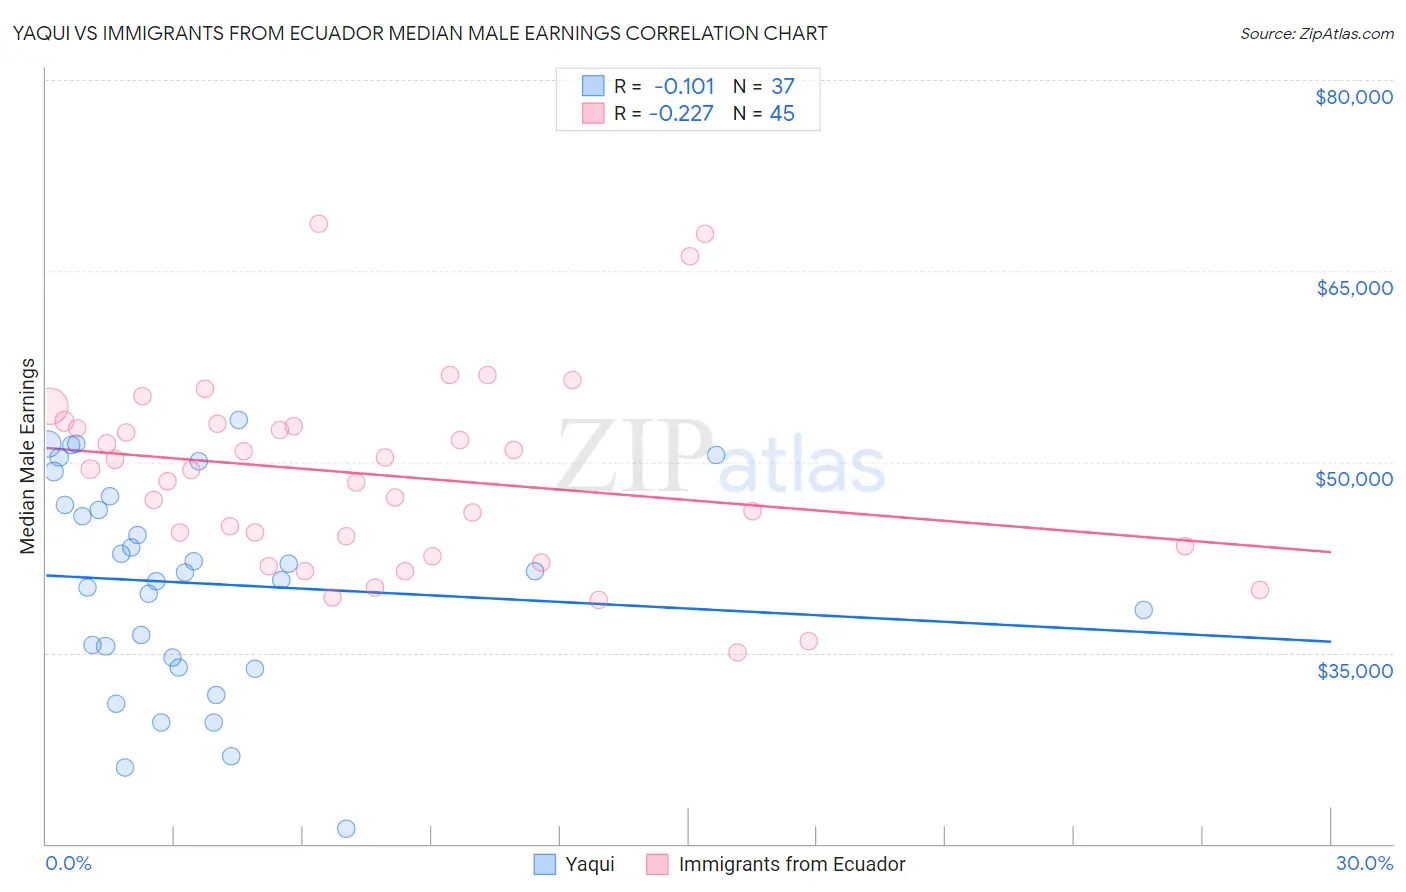
Yaqui vs Immigrants from Ecuador Median Male Earnings Correlation Chart
The statistical analysis conducted on geographies consisting of 107,723,867 people shows a poor negative correlation between the proportion of Yaqui and median male earnings in the United States with a correlation coefficient (R) of -0.101 and weighted average of $46,777. Similarly, the statistical analysis conducted on geographies consisting of 270,963,841 people shows a weak negative correlation between the proportion of Immigrants from Ecuador and median male earnings in the United States with a correlation coefficient (R) of -0.227 and weighted average of $50,474, a difference of 7.9%.
Median Male Earnings Correlation Summary
| Measurement | Yaqui | Immigrants from Ecuador |
| Minimum | $21,192 | $35,014 |
| Maximum | $53,274 | $68,684 |
| Range | $32,082 | $33,670 |
| Mean | $40,430 | $48,933 |
| Median | $41,328 | $49,320 |
| Interquartile 25% (IQ1) | $34,244 | $42,981 |
| Interquartile 75% (IQ3) | $46,983 | $52,866 |
| Interquartile Range (IQR) | $12,738 | $9,884 |
| Standard Deviation (Sample) | $8,232 | $7,606 |
| Standard Deviation (Population) | $8,120 | $7,521 |
Similar Demographics by Median Male Earnings
Demographics Similar to Yaqui by Median Male Earnings
In terms of median male earnings, the demographic groups most similar to Yaqui are Seminole ($46,783, a difference of 0.010%), Bangladeshi ($46,744, a difference of 0.070%), Guatemalan ($46,736, a difference of 0.090%), Dutch West Indian ($46,656, a difference of 0.26%), and Immigrants from Dominican Republic ($46,655, a difference of 0.26%).
| Demographics | Rating | Rank | Median Male Earnings |
| Inupiat | 0.1 /100 | #296 | Tragic $47,281 |
| Dominicans | 0.1 /100 | #297 | Tragic $47,204 |
| Immigrants | Micronesia | 0.1 /100 | #298 | Tragic $47,177 |
| Immigrants | Zaire | 0.1 /100 | #299 | Tragic $47,070 |
| U.S. Virgin Islanders | 0.1 /100 | #300 | Tragic $47,066 |
| Immigrants | Latin America | 0.1 /100 | #301 | Tragic $46,941 |
| Seminole | 0.1 /100 | #302 | Tragic $46,783 |
| Yaqui | 0.1 /100 | #303 | Tragic $46,777 |
| Bangladeshis | 0.1 /100 | #304 | Tragic $46,744 |
| Guatemalans | 0.0 /100 | #305 | Tragic $46,736 |
| Dutch West Indians | 0.0 /100 | #306 | Tragic $46,656 |
| Immigrants | Dominican Republic | 0.0 /100 | #307 | Tragic $46,655 |
| Ottawa | 0.0 /100 | #308 | Tragic $46,611 |
| Creek | 0.0 /100 | #309 | Tragic $46,594 |
| Cubans | 0.0 /100 | #310 | Tragic $46,580 |
Demographics Similar to Immigrants from Ecuador by Median Male Earnings
In terms of median male earnings, the demographic groups most similar to Immigrants from Ecuador are Hawaiian ($50,488, a difference of 0.030%), Subsaharan African ($50,408, a difference of 0.13%), Houma ($50,547, a difference of 0.14%), Guyanese ($50,613, a difference of 0.27%), and French American Indian ($50,611, a difference of 0.27%).
| Demographics | Rating | Rank | Median Male Earnings |
| Americans | 2.5 /100 | #239 | Tragic $50,761 |
| West Indians | 2.3 /100 | #240 | Tragic $50,682 |
| Immigrants | St. Vincent and the Grenadines | 2.3 /100 | #241 | Tragic $50,665 |
| Guyanese | 2.2 /100 | #242 | Tragic $50,613 |
| French American Indians | 2.2 /100 | #243 | Tragic $50,611 |
| Houma | 2.0 /100 | #244 | Tragic $50,547 |
| Hawaiians | 1.9 /100 | #245 | Tragic $50,488 |
| Immigrants | Ecuador | 1.9 /100 | #246 | Tragic $50,474 |
| Sub-Saharan Africans | 1.8 /100 | #247 | Tragic $50,408 |
| Immigrants | Guyana | 1.6 /100 | #248 | Tragic $50,321 |
| Immigrants | Burma/Myanmar | 1.6 /100 | #249 | Tragic $50,298 |
| Osage | 1.6 /100 | #250 | Tragic $50,292 |
| Immigrants | Grenada | 1.6 /100 | #251 | Tragic $50,279 |
| Immigrants | Cabo Verde | 1.2 /100 | #252 | Tragic $50,009 |
| German Russians | 1.1 /100 | #253 | Tragic $49,924 |