Yaqui vs Immigrants from Ecuador 5th Grade

COMPARE

Yaqui
Race
Ancestry
AfghanAfricanAlaska NativeAlaskan AthabascanAlbanianAleutAlsatianAmericanApacheArabArapahoArgentineanArmenianAssyrian/Chaldean/SyriacAustralianAustrianBahamianBangladeshiBarbadianBasqueBelgianBelizeanBermudanBhutaneseBlackfeetBolivianBrazilianBritishBritish West IndianBulgarianBurmeseCajunCambodianCanadianCape VerdeanCarpatho RusynCelticCentral AmericanCentral American IndianCherokeeCheyenneChickasawChileanChineseChippewaChoctawColombianColvilleComancheCosta RicanCreeCreekCroatianCrowCubanCypriotCzechCzechoslovakianDanishDelawareDominicanDutchDutch West IndianEastern EuropeanEcuadorianEgyptianEnglishEstonianEthiopianEuropeanFijianFilipinoFinnishFrenchFrench American IndianFrench CanadianGermanGerman RussianGhanaianGreekGuamanian/ChamorroGuatemalanGuyaneseHaitianHmongHonduranHopiHoumaHungarianIcelanderIndian (Asian)IndonesianInupiatIranianIraqiIrishIroquoisIsraeliItalianJamaicanJapaneseJordanianKenyanKiowaKoreanLaotianLatvianLebaneseLiberianLithuanianLumbeeLuxembourgerMacedonianMalaysianMalteseMarshalleseMenomineeMexicanMexican American IndianMongolianMoroccanNative HawaiianNavajoNepaleseNew ZealanderNicaraguanNigerianNorthern EuropeanNorwegianOkinawanOsageOttawaPaiutePakistaniPalestinianPanamanianParaguayanPennsylvania GermanPeruvianPimaPolishPortuguesePotawatomiPuebloPuerto RicanPuget Sound SalishRomanianRussianSalvadoranSamoanScandinavianScotch-IrishScottishSeminoleSenegaleseSerbianShoshoneSierra LeoneanSiouxSlavicSlovakSloveneSomaliSouth AfricanSouth AmericanSouth American IndianSoviet UnionSpaniardSpanishSpanish AmericanSpanish American IndianSri LankanSubsaharan AfricanSudaneseSwedishSwissSyrianTaiwaneseThaiTlingit-HaidaTohono O'OdhamTonganTrinidadian and TobagonianTsimshianTurkishU.S. Virgin IslanderUgandanUkrainianUruguayanUteVenezuelanVietnameseWelshWest IndianYakamaYaquiYugoslavianYumanYup'ikZimbabwean
Immigration
NonimmigrantsImmigrantsAfghanistanAfricaAlbaniaArgentinaArmeniaAsiaAustraliaAustriaBahamasBangladeshBarbadosBelarusBelgiumBelizeBoliviaBosnia and HerzegovinaBrazilBulgariaBurma/MyanmarCabo VerdeCambodiaCameroonCanadaCaribbeanCentral AmericaChileChinaColombiaCongoCosta RicaCroatiaCubaCzechoslovakiaDenmarkDominicaDominican RepublicEastern AfricaEastern AsiaEastern EuropeEgyptEl SalvadorEnglandEritreaEthiopiaEuropeFijiFranceGermanyGhanaGreeceGrenadaGuatemalaGuyanaHaitiHondurasHong KongHungaryIndiaIndonesiaIranIraqIrelandIsraelItalyJamaicaJapanJordanKazakhstanKenyaKoreaKuwaitLaosLatin AmericaLatviaLebanonLiberiaLithuaniaMalaysiaMexicoMicronesiaMiddle AfricaMoldovaMoroccoNepalNetherlandsNicaraguaNigeriaNorth AmericaNorth MacedoniaNorthern AfricaNorthern EuropeNorwayOceaniaPakistanPanamaPeruPhilippinesPolandPortugalRomaniaRussiaSaudi ArabiaScotlandSenegalSerbiaSierra LeoneSingaporeSomaliaSouth AfricaSouth AmericaSouth Central AsiaSouth Eastern AsiaSouthern EuropeSpainSri LankaSt. Vincent and the GrenadinesSudanSwedenSwitzerlandSyriaTaiwanThailandTrinidad and TobagoTurkeyUgandaUkraineUruguayUzbekistanVenezuelaVietnamWest IndiesWestern AfricaWestern AsiaWestern EuropeYemenZaireZimbabweAzores
Immigrants from Ecuador
Race
Ancestry
AfghanAfricanAlaska NativeAlaskan AthabascanAlbanianAleutAlsatianAmericanApacheArabArapahoArgentineanArmenianAssyrian/Chaldean/SyriacAustralianAustrianBahamianBangladeshiBarbadianBasqueBelgianBelizeanBermudanBhutaneseBlackfeetBolivianBrazilianBritishBritish West IndianBulgarianBurmeseCajunCambodianCanadianCape VerdeanCarpatho RusynCelticCentral AmericanCentral American IndianCherokeeCheyenneChickasawChileanChineseChippewaChoctawColombianColvilleComancheCosta RicanCreeCreekCroatianCrowCubanCypriotCzechCzechoslovakianDanishDelawareDominicanDutchDutch West IndianEastern EuropeanEcuadorianEgyptianEnglishEstonianEthiopianEuropeanFijianFilipinoFinnishFrenchFrench American IndianFrench CanadianGermanGerman RussianGhanaianGreekGuamanian/ChamorroGuatemalanGuyaneseHaitianHmongHonduranHopiHoumaHungarianIcelanderIndian (Asian)IndonesianInupiatIranianIraqiIrishIroquoisIsraeliItalianJamaicanJapaneseJordanianKenyanKiowaKoreanLaotianLatvianLebaneseLiberianLithuanianLumbeeLuxembourgerMacedonianMalaysianMalteseMarshalleseMenomineeMexicanMexican American IndianMongolianMoroccanNative HawaiianNavajoNepaleseNew ZealanderNicaraguanNigerianNorthern EuropeanNorwegianOkinawanOsageOttawaPaiutePakistaniPalestinianPanamanianParaguayanPennsylvania GermanPeruvianPimaPolishPortuguesePotawatomiPuebloPuerto RicanPuget Sound SalishRomanianRussianSalvadoranSamoanScandinavianScotch-IrishScottishSeminoleSenegaleseSerbianShoshoneSierra LeoneanSiouxSlavicSlovakSloveneSomaliSouth AfricanSouth AmericanSouth American IndianSoviet UnionSpaniardSpanishSpanish AmericanSpanish American IndianSri LankanSubsaharan AfricanSudaneseSwedishSwissSyrianTaiwaneseThaiTlingit-HaidaTohono O'OdhamTonganTrinidadian and TobagonianTsimshianTurkishU.S. Virgin IslanderUgandanUkrainianUruguayanUteVenezuelanVietnameseWelshWest IndianYakamaYugoslavianYumanYup'ikZimbabwean
Immigration
NonimmigrantsImmigrantsAfghanistanAfricaAlbaniaArgentinaArmeniaAsiaAustraliaAustriaBahamasBangladeshBarbadosBelarusBelgiumBelizeBoliviaBosnia and HerzegovinaBrazilBulgariaBurma/MyanmarCabo VerdeCambodiaCameroonCanadaCaribbeanCentral AmericaChileChinaColombiaCongoCosta RicaCroatiaCubaCzechoslovakiaDenmarkDominicaDominican RepublicEastern AfricaEastern AsiaEastern EuropeEcuadorEgyptEl SalvadorEnglandEritreaEthiopiaEuropeFijiFranceGermanyGhanaGreeceGrenadaGuatemalaGuyanaHaitiHondurasHong KongHungaryIndiaIndonesiaIranIraqIrelandIsraelItalyJamaicaJapanJordanKazakhstanKenyaKoreaKuwaitLaosLatin AmericaLatviaLebanonLiberiaLithuaniaMalaysiaMexicoMicronesiaMiddle AfricaMoldovaMoroccoNepalNetherlandsNicaraguaNigeriaNorth AmericaNorth MacedoniaNorthern AfricaNorthern EuropeNorwayOceaniaPakistanPanamaPeruPhilippinesPolandPortugalRomaniaRussiaSaudi ArabiaScotlandSenegalSerbiaSierra LeoneSingaporeSomaliaSouth AfricaSouth AmericaSouth Central AsiaSouth Eastern AsiaSouthern EuropeSpainSri LankaSt. Vincent and the GrenadinesSudanSwedenSwitzerlandSyriaTaiwanThailandTrinidad and TobagoTurkeyUgandaUkraineUruguayUzbekistanVenezuelaVietnamWest IndiesWestern AfricaWestern AsiaWestern EuropeYemenZaireZimbabweAzores
5th Grade
Income
Poverty
Unemployment
Labor Participation
Family Structure
Vehicle Availability
Education Level
Disability

5th Grade Comparison

Yaqui

Immigrants from Ecuador

Tragic
Tragic
96.7%
5TH GRADE
0.1/ 100
METRIC RATING
273rd/ 347
METRIC RANK
95.8%
5TH GRADE
0.0/ 100
METRIC RATING
316th/ 347
METRIC RANK

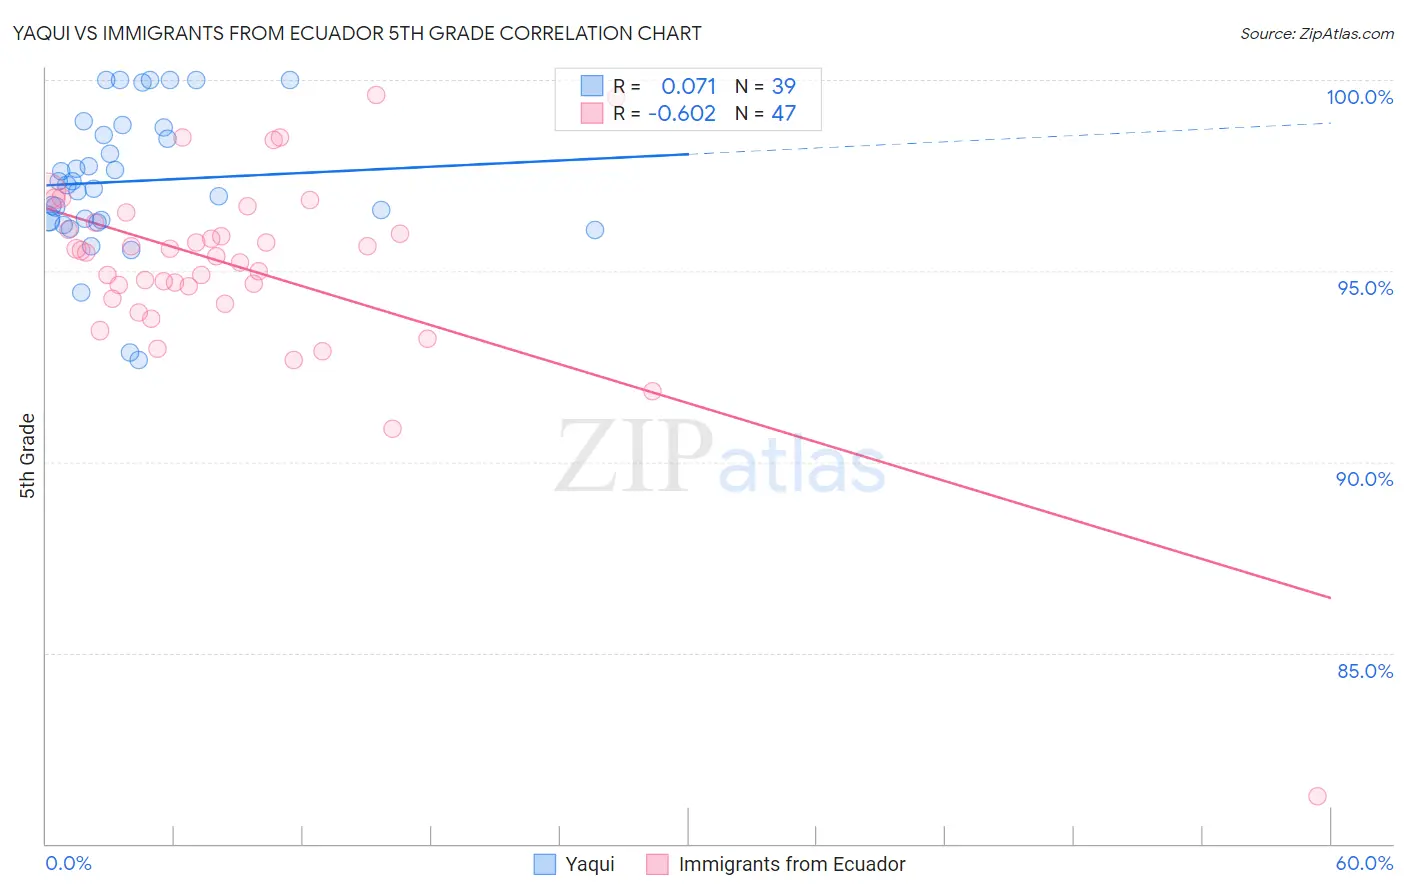
Yaqui vs Immigrants from Ecuador 5th Grade Correlation Chart

The statistical analysis conducted on geographies consisting of 107,725,021 people shows a slight positive correlation between the proportion of Yaqui and percentage of population with at least 5th grade education in the United States with a correlation coefficient (R) of 0.071 and weighted average of 96.7%. Similarly, the statistical analysis conducted on geographies consisting of 271,020,679 people shows a significant negative correlation between the proportion of Immigrants from Ecuador and percentage of population with at least 5th grade education in the United States with a correlation coefficient (R) of -0.602 and weighted average of 95.8%, a difference of 0.87%.
Yaqui vs Immigrants from Ecuador 5th Grade

5th Grade Correlation Summary

MeasurementYaquiImmigrants from Ecuador
Minimum92.7%81.2%
Maximum100.0%99.6%
Range7.3%18.3%
Mean97.3%95.1%
Median97.2%95.5%
Interquartile 25% (IQ1)96.3%94.3%
Interquartile 75% (IQ3)98.8%96.3%
Interquartile Range (IQR)2.5%2.0%
Standard Deviation (Sample)1.8%2.7%
Standard Deviation (Population)1.8%2.7%

Similar Demographics by 5th Grade

Demographics Similar to Yaqui by 5th Grade

In terms of 5th grade, the demographic groups most similar to Yaqui are Immigrants from Cameroon (96.7%, a difference of 0.0%), Trinidadian and Tobagonian (96.7%, a difference of 0.010%), Immigrants from Peru (96.6%, a difference of 0.010%), Cuban (96.6%, a difference of 0.010%), and Immigrants from Bolivia (96.6%, a difference of 0.010%).
DemographicsRating | Rank5th Grade
Immigrants | Nigeria
0.3
/100
|
#266
Tragic
96.7%
Immigrants | South America
0.3
/100
|
#267
Tragic
96.7%
Armenians
0.3
/100
|
#268
Tragic
96.7%
Ghanaians
0.2
/100
|
#269
Tragic
96.7%
Afghans
0.2
/100
|
#270
Tragic
96.7%
Immigrants | Hong Kong
0.2
/100
|
#271
Tragic
96.7%
Trinidadians and Tobagonians
0.1
/100
|
#272
Tragic
96.7%
Yaqui
0.1
/100
|
#273
Tragic
96.7%
Immigrants | Cameroon
0.1
/100
|
#274
Tragic
96.7%
Immigrants | Peru
0.1
/100
|
#275
Tragic
96.6%
Cubans
0.1
/100
|
#276
Tragic
96.6%
Immigrants | Bolivia
0.1
/100
|
#277
Tragic
96.6%
Immigrants | Ghana
0.1
/100
|
#278
Tragic
96.6%
Immigrants | Philippines
0.1
/100
|
#279
Tragic
96.6%
Immigrants | Western Africa
0.1
/100
|
#280
Tragic
96.6%

Demographics Similar to Immigrants from Ecuador by 5th Grade

In terms of 5th grade, the demographic groups most similar to Immigrants from Ecuador are Belizean (95.8%, a difference of 0.030%), Immigrants from Vietnam (95.8%, a difference of 0.050%), Nicaraguan (95.9%, a difference of 0.060%), Bangladeshi (95.9%, a difference of 0.080%), and Immigrants from Portugal (95.9%, a difference of 0.080%).
DemographicsRating | Rank5th Grade
Immigrants | Guyana
0.0
/100
|
#309
Tragic
96.0%
Indonesians
0.0
/100
|
#310
Tragic
96.0%
Immigrants | Bangladesh
0.0
/100
|
#311
Tragic
96.0%
Vietnamese
0.0
/100
|
#312
Tragic
95.9%
Bangladeshis
0.0
/100
|
#313
Tragic
95.9%
Immigrants | Portugal
0.0
/100
|
#314
Tragic
95.9%
Nicaraguans
0.0
/100
|
#315
Tragic
95.9%
Immigrants | Ecuador
0.0
/100
|
#316
Tragic
95.8%
Belizeans
0.0
/100
|
#317
Tragic
95.8%
Immigrants | Vietnam
0.0
/100
|
#318
Tragic
95.8%
Japanese
0.0
/100
|
#319
Tragic
95.7%
Central American Indians
0.0
/100
|
#320
Tragic
95.7%
Immigrants | Belize
0.0
/100
|
#321
Tragic
95.7%
Immigrants | Nicaragua
0.0
/100
|
#322
Tragic
95.6%
Immigrants | Fiji
0.0
/100
|
#323
Tragic
95.6%