Uruguayan vs Spanish Per Capita Income
COMPARE
Uruguayan
Spanish
Per Capita Income
Per Capita Income Comparison
Uruguayans
Spanish
$44,318
PER CAPITA INCOME
67.6/ 100
METRIC RATING
155th/ 347
METRIC RANK
$42,249
PER CAPITA INCOME
17.0/ 100
METRIC RATING
203rd/ 347
METRIC RANK
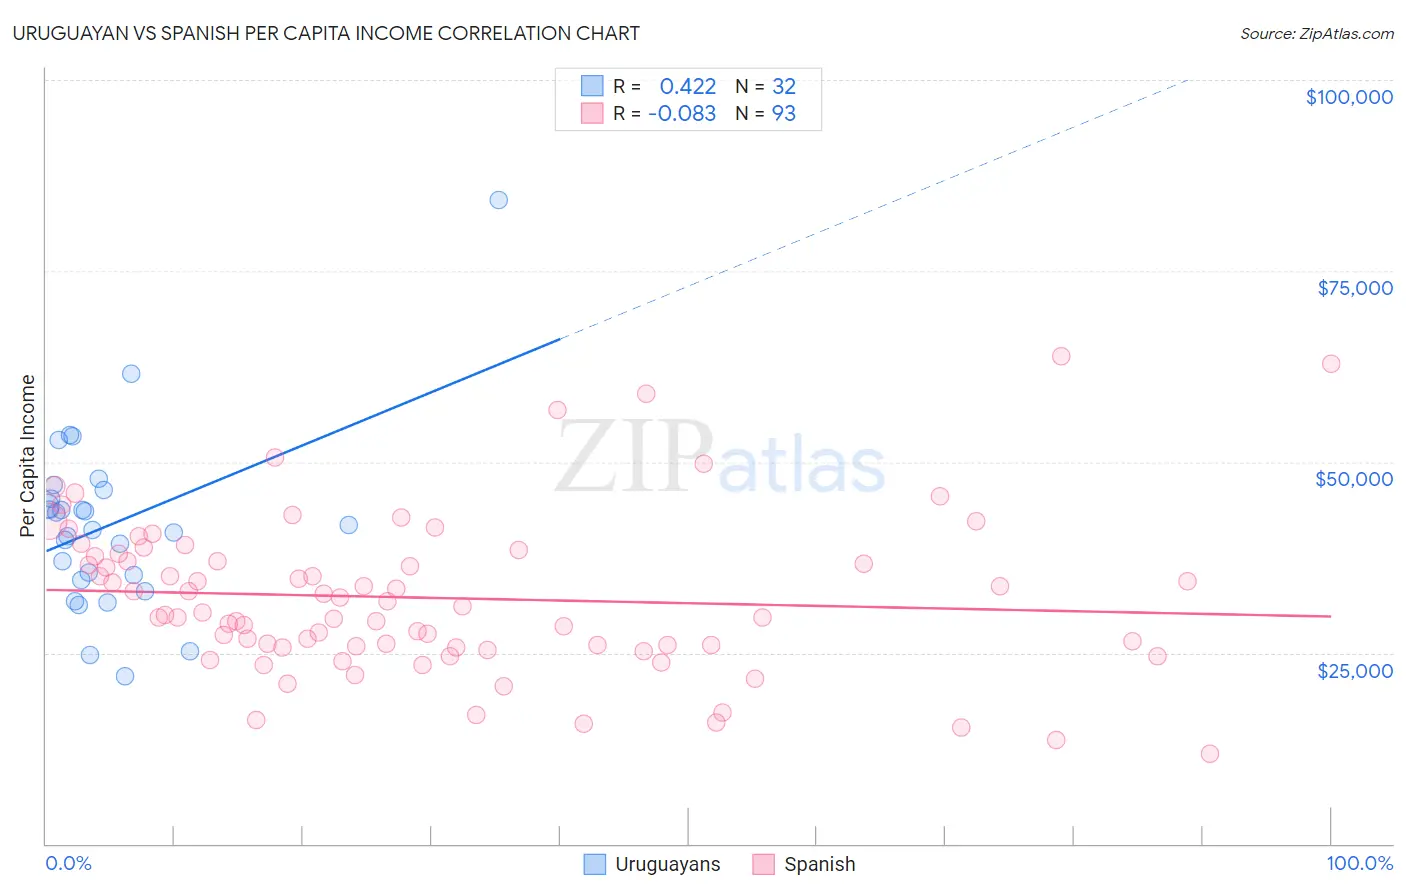
Uruguayan vs Spanish Per Capita Income Correlation Chart
The statistical analysis conducted on geographies consisting of 144,785,218 people shows a moderate positive correlation between the proportion of Uruguayans and per capita income in the United States with a correlation coefficient (R) of 0.422 and weighted average of $44,318. Similarly, the statistical analysis conducted on geographies consisting of 422,211,321 people shows a slight negative correlation between the proportion of Spanish and per capita income in the United States with a correlation coefficient (R) of -0.083 and weighted average of $42,249, a difference of 4.9%.
Per Capita Income Correlation Summary
| Measurement | Uruguayan | Spanish |
| Minimum | $21,859 | $11,849 |
| Maximum | $84,313 | $63,855 |
| Range | $62,454 | $52,006 |
| Mean | $41,831 | $32,202 |
| Median | $41,436 | $30,353 |
| Interquartile 25% (IQ1) | $34,824 | $25,756 |
| Interquartile 75% (IQ3) | $45,774 | $37,741 |
| Interquartile Range (IQR) | $10,950 | $11,984 |
| Standard Deviation (Sample) | $11,692 | $10,280 |
| Standard Deviation (Population) | $11,508 | $10,225 |
Similar Demographics by Per Capita Income
Demographics Similar to Uruguayans by Per Capita Income
In terms of per capita income, the demographic groups most similar to Uruguayans are Portuguese ($44,362, a difference of 0.10%), Slovak ($44,229, a difference of 0.20%), South American Indian ($44,206, a difference of 0.25%), Scottish ($44,440, a difference of 0.27%), and Immigrants from Nepal ($44,187, a difference of 0.30%).
| Demographics | Rating | Rank | Per Capita Income |
| Immigrants | Armenia | 73.1 /100 | #148 | Good $44,552 |
| Koreans | 72.5 /100 | #149 | Good $44,522 |
| Immigrants | Eritrea | 72.1 /100 | #150 | Good $44,509 |
| Norwegians | 71.5 /100 | #151 | Good $44,480 |
| Peruvians | 71.5 /100 | #152 | Good $44,479 |
| Scottish | 70.6 /100 | #153 | Good $44,440 |
| Portuguese | 68.7 /100 | #154 | Good $44,362 |
| Uruguayans | 67.6 /100 | #155 | Good $44,318 |
| Slovaks | 65.4 /100 | #156 | Good $44,229 |
| South American Indians | 64.8 /100 | #157 | Good $44,206 |
| Immigrants | Nepal | 64.3 /100 | #158 | Good $44,187 |
| South Americans | 62.4 /100 | #159 | Good $44,114 |
| Danes | 61.9 /100 | #160 | Good $44,095 |
| Costa Ricans | 61.8 /100 | #161 | Good $44,090 |
| Swiss | 61.4 /100 | #162 | Good $44,076 |
Demographics Similar to Spanish by Per Capita Income
In terms of per capita income, the demographic groups most similar to Spanish are Immigrants from Bosnia and Herzegovina ($42,278, a difference of 0.070%), Immigrants from Thailand ($42,289, a difference of 0.090%), Aleut ($42,210, a difference of 0.090%), White/Caucasian ($42,180, a difference of 0.16%), and Ghanaian ($42,164, a difference of 0.20%).
| Demographics | Rating | Rank | Per Capita Income |
| Dutch | 23.4 /100 | #196 | Fair $42,605 |
| Scotch-Irish | 22.6 /100 | #197 | Fair $42,563 |
| Immigrants | Portugal | 19.7 /100 | #198 | Poor $42,412 |
| Barbadians | 19.6 /100 | #199 | Poor $42,406 |
| Vietnamese | 19.0 /100 | #200 | Poor $42,368 |
| Immigrants | Thailand | 17.6 /100 | #201 | Poor $42,289 |
| Immigrants | Bosnia and Herzegovina | 17.5 /100 | #202 | Poor $42,278 |
| Spanish | 17.0 /100 | #203 | Poor $42,249 |
| Aleuts | 16.4 /100 | #204 | Poor $42,210 |
| Whites/Caucasians | 15.9 /100 | #205 | Poor $42,180 |
| Ghanaians | 15.7 /100 | #206 | Poor $42,164 |
| Venezuelans | 14.4 /100 | #207 | Poor $42,074 |
| Panamanians | 13.9 /100 | #208 | Poor $42,035 |
| Immigrants | Sudan | 13.2 /100 | #209 | Poor $41,986 |
| Ecuadorians | 12.9 /100 | #210 | Poor $41,958 |