Tohono O'odham vs Immigrants from Spain Per Capita Income

COMPARE

Tohono O'odham
Race
Ancestry
AfghanAfricanAlaska NativeAlaskan AthabascanAlbanianAleutAlsatianAmericanApacheArabArapahoArgentineanArmenianAssyrian/Chaldean/SyriacAustralianAustrianBahamianBangladeshiBarbadianBasqueBelgianBelizeanBermudanBhutaneseBlackfeetBolivianBrazilianBritishBritish West IndianBulgarianBurmeseCajunCambodianCanadianCape VerdeanCarpatho RusynCelticCentral AmericanCentral American IndianCherokeeCheyenneChickasawChileanChineseChippewaChoctawColombianColvilleComancheCosta RicanCreeCreekCroatianCrowCubanCypriotCzechCzechoslovakianDanishDelawareDominicanDutchDutch West IndianEastern EuropeanEcuadorianEgyptianEnglishEstonianEthiopianEuropeanFijianFilipinoFinnishFrenchFrench American IndianFrench CanadianGermanGerman RussianGhanaianGreekGuamanian/ChamorroGuatemalanGuyaneseHaitianHmongHonduranHopiHoumaHungarianIcelanderIndian (Asian)IndonesianInupiatIranianIraqiIrishIroquoisIsraeliItalianJamaicanJapaneseJordanianKenyanKiowaKoreanLaotianLatvianLebaneseLiberianLithuanianLumbeeLuxembourgerMacedonianMalaysianMalteseMarshalleseMenomineeMexicanMexican American IndianMongolianMoroccanNative HawaiianNavajoNepaleseNew ZealanderNicaraguanNigerianNorthern EuropeanNorwegianOkinawanOsageOttawaPaiutePakistaniPalestinianPanamanianParaguayanPennsylvania GermanPeruvianPimaPolishPortuguesePotawatomiPuebloPuerto RicanPuget Sound SalishRomanianRussianSalvadoranSamoanScandinavianScotch-IrishScottishSeminoleSenegaleseSerbianShoshoneSierra LeoneanSiouxSlavicSlovakSloveneSomaliSouth AfricanSouth AmericanSouth American IndianSoviet UnionSpaniardSpanishSpanish AmericanSpanish American IndianSri LankanSubsaharan AfricanSudaneseSwedishSwissSyrianTaiwaneseThaiTlingit-HaidaTohono O'OdhamTonganTrinidadian and TobagonianTsimshianTurkishU.S. Virgin IslanderUgandanUkrainianUruguayanUteVenezuelanVietnameseWelshWest IndianYakamaYaquiYugoslavianYumanYup'ikZimbabwean
Immigration
NonimmigrantsImmigrantsAfghanistanAfricaAlbaniaArgentinaArmeniaAsiaAustraliaAustriaBahamasBangladeshBarbadosBelarusBelgiumBelizeBoliviaBosnia and HerzegovinaBrazilBulgariaBurma/MyanmarCabo VerdeCambodiaCameroonCanadaCaribbeanCentral AmericaChileChinaColombiaCongoCosta RicaCroatiaCubaCzechoslovakiaDenmarkDominicaDominican RepublicEastern AfricaEastern AsiaEastern EuropeEcuadorEgyptEl SalvadorEnglandEritreaEthiopiaEuropeFijiFranceGermanyGhanaGreeceGrenadaGuatemalaGuyanaHaitiHondurasHong KongHungaryIndiaIndonesiaIranIraqIrelandIsraelItalyJamaicaJapanJordanKazakhstanKenyaKoreaKuwaitLaosLatin AmericaLatviaLebanonLiberiaLithuaniaMalaysiaMexicoMicronesiaMiddle AfricaMoldovaMoroccoNepalNetherlandsNicaraguaNigeriaNorth AmericaNorth MacedoniaNorthern AfricaNorthern EuropeNorwayOceaniaPakistanPanamaPeruPhilippinesPolandPortugalRomaniaRussiaSaudi ArabiaScotlandSenegalSerbiaSierra LeoneSingaporeSomaliaSouth AfricaSouth AmericaSouth Central AsiaSouth Eastern AsiaSouthern EuropeSri LankaSt. Vincent and the GrenadinesSudanSwedenSwitzerlandSyriaTaiwanThailandTrinidad and TobagoTurkeyUgandaUkraineUruguayUzbekistanVenezuelaVietnamWest IndiesWestern AfricaWestern AsiaWestern EuropeYemenZaireZimbabweAzores
Immigrants from Spain
Race
Ancestry
AfghanAfricanAlaska NativeAlaskan AthabascanAlbanianAleutAlsatianAmericanApacheArabArapahoArgentineanArmenianAssyrian/Chaldean/SyriacAustralianAustrianBahamianBangladeshiBarbadianBasqueBelgianBelizeanBermudanBhutaneseBlackfeetBolivianBrazilianBritishBritish West IndianBulgarianBurmeseCajunCambodianCanadianCape VerdeanCarpatho RusynCelticCentral AmericanCentral American IndianCherokeeCheyenneChickasawChileanChineseChippewaChoctawColombianColvilleComancheCosta RicanCreeCreekCroatianCrowCubanCypriotCzechCzechoslovakianDanishDelawareDominicanDutchDutch West IndianEastern EuropeanEcuadorianEgyptianEnglishEstonianEthiopianEuropeanFijianFilipinoFinnishFrenchFrench American IndianFrench CanadianGermanGerman RussianGhanaianGreekGuamanian/ChamorroGuatemalanGuyaneseHaitianHmongHonduranHopiHoumaHungarianIcelanderIndian (Asian)IndonesianInupiatIranianIraqiIrishIroquoisIsraeliItalianJamaicanJapaneseJordanianKenyanKiowaKoreanLaotianLatvianLebaneseLiberianLithuanianLumbeeLuxembourgerMacedonianMalaysianMalteseMarshalleseMenomineeMexicanMexican American IndianMongolianMoroccanNative HawaiianNavajoNepaleseNew ZealanderNicaraguanNigerianNorthern EuropeanNorwegianOkinawanOsageOttawaPaiutePakistaniPalestinianPanamanianParaguayanPennsylvania GermanPeruvianPimaPolishPortuguesePotawatomiPuebloPuerto RicanPuget Sound SalishRomanianRussianSalvadoranSamoanScandinavianScotch-IrishScottishSeminoleSenegaleseSerbianShoshoneSierra LeoneanSiouxSlavicSlovakSloveneSomaliSouth AfricanSouth AmericanSouth American IndianSoviet UnionSpaniardSpanishSpanish AmericanSpanish American IndianSri LankanSubsaharan AfricanSudaneseSwedishSwissSyrianTaiwaneseThaiTlingit-HaidaTonganTrinidadian and TobagonianTsimshianTurkishU.S. Virgin IslanderUgandanUkrainianUruguayanUteVenezuelanVietnameseWelshWest IndianYakamaYaquiYugoslavianYumanYup'ikZimbabwean
Immigration
NonimmigrantsImmigrantsAfghanistanAfricaAlbaniaArgentinaArmeniaAsiaAustraliaAustriaBahamasBangladeshBarbadosBelarusBelgiumBelizeBoliviaBosnia and HerzegovinaBrazilBulgariaBurma/MyanmarCabo VerdeCambodiaCameroonCanadaCaribbeanCentral AmericaChileChinaColombiaCongoCosta RicaCroatiaCubaCzechoslovakiaDenmarkDominicaDominican RepublicEastern AfricaEastern AsiaEastern EuropeEcuadorEgyptEl SalvadorEnglandEritreaEthiopiaEuropeFijiFranceGermanyGhanaGreeceGrenadaGuatemalaGuyanaHaitiHondurasHong KongHungaryIndiaIndonesiaIranIraqIrelandIsraelItalyJamaicaJapanJordanKazakhstanKenyaKoreaKuwaitLaosLatin AmericaLatviaLebanonLiberiaLithuaniaMalaysiaMexicoMicronesiaMiddle AfricaMoldovaMoroccoNepalNetherlandsNicaraguaNigeriaNorth AmericaNorth MacedoniaNorthern AfricaNorthern EuropeNorwayOceaniaPakistanPanamaPeruPhilippinesPolandPortugalRomaniaRussiaSaudi ArabiaScotlandSenegalSerbiaSierra LeoneSingaporeSomaliaSouth AfricaSouth AmericaSouth Central AsiaSouth Eastern AsiaSouthern EuropeSpainSri LankaSt. Vincent and the GrenadinesSudanSwedenSwitzerlandSyriaTaiwanThailandTrinidad and TobagoTurkeyUgandaUkraineUruguayUzbekistanVenezuelaVietnamWest IndiesWestern AfricaWestern AsiaWestern EuropeYemenZaireZimbabweAzores
Per Capita Income
Income
Poverty
Unemployment
Labor Participation
Family Structure
Vehicle Availability
Education Level
Disability

Per Capita Income Comparison

Tohono O'odham

Immigrants from Spain

Tragic
Exceptional
$30,256
PER CAPITA INCOME
0.0/ 100
METRIC RATING
345th/ 347
METRIC RANK
$50,933
PER CAPITA INCOME
100.0/ 100
METRIC RATING
45th/ 347
METRIC RANK

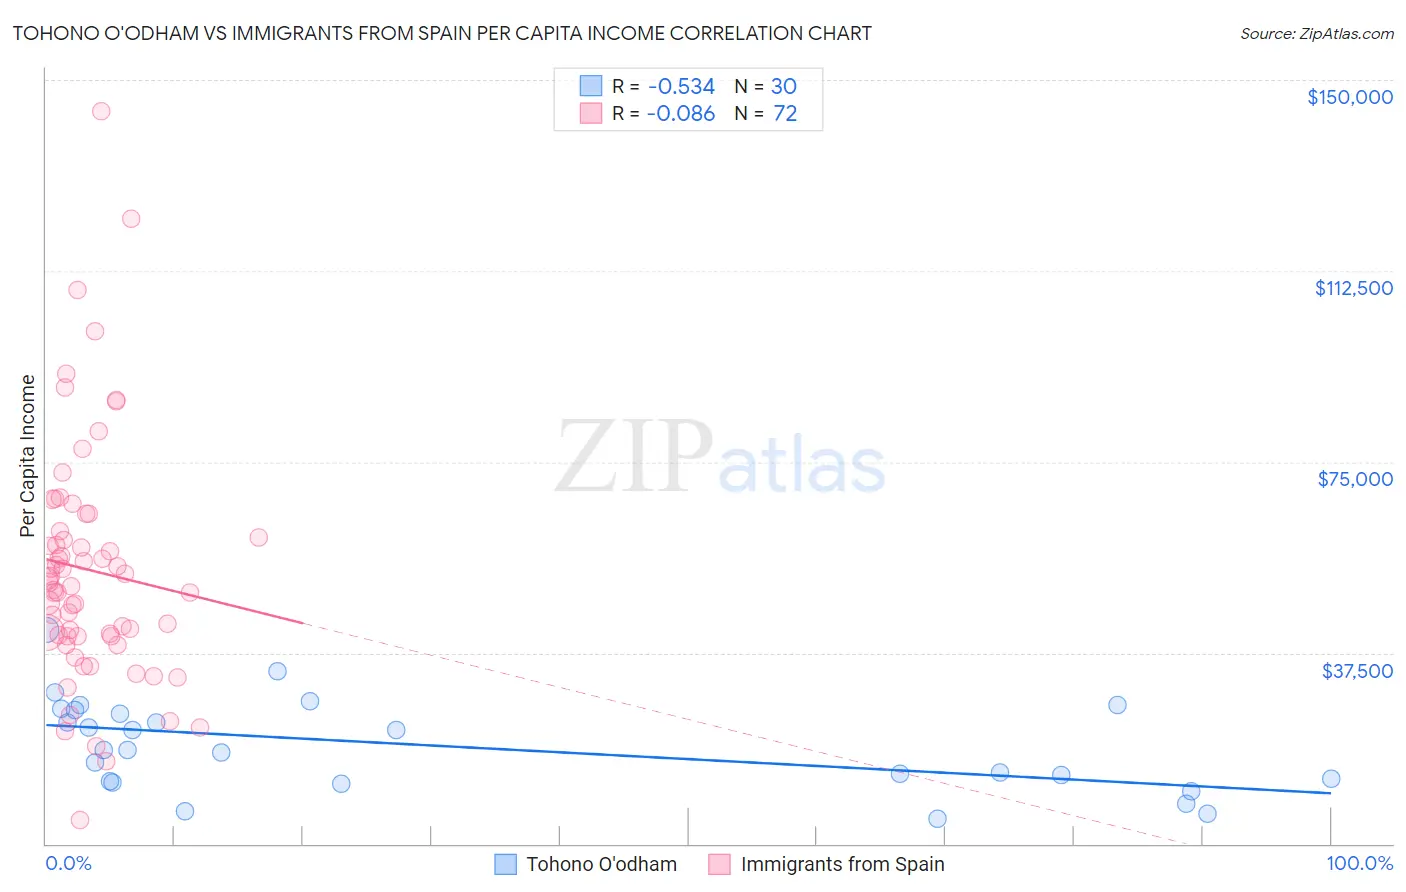
Tohono O'odham vs Immigrants from Spain Per Capita Income Correlation Chart

The statistical analysis conducted on geographies consisting of 58,730,368 people shows a substantial negative correlation between the proportion of Tohono O'odham and per capita income in the United States with a correlation coefficient (R) of -0.534 and weighted average of $30,256. Similarly, the statistical analysis conducted on geographies consisting of 239,686,141 people shows a slight negative correlation between the proportion of Immigrants from Spain and per capita income in the United States with a correlation coefficient (R) of -0.086 and weighted average of $50,933, a difference of 68.3%.
Tohono O'odham vs Immigrants from Spain Per Capita Income

Per Capita Income Correlation Summary

MeasurementTohono O'odhamImmigrants from Spain
Minimum$4,874$4,617
Maximum$41,987$143,860
Range$37,113$139,243
Mean$19,246$53,783
Median$18,448$50,941
Interquartile 25% (IQ1)$12,324$40,770
Interquartile 75% (IQ3)$26,227$60,698
Interquartile Range (IQR)$13,903$19,928
Standard Deviation (Sample)$8,934$23,693
Standard Deviation (Population)$8,784$23,528

Similar Demographics by Per Capita Income

Demographics Similar to Tohono O'odham by Per Capita Income

In terms of per capita income, the demographic groups most similar to Tohono O'odham are Yup'ik ($30,518, a difference of 0.87%), Pima ($30,644, a difference of 1.3%), Lumbee ($29,845, a difference of 1.4%), Hopi ($31,177, a difference of 3.0%), and Puerto Rican ($31,268, a difference of 3.4%).
DemographicsRating | RankPer Capita Income
Immigrants | Yemen
0.0
/100
|
#333
Tragic
$33,696
Natives/Alaskans
0.0
/100
|
#334
Tragic
$33,279
Yuman
0.0
/100
|
#335
Tragic
$33,236
Yakama
0.0
/100
|
#336
Tragic
$33,009
Houma
0.0
/100
|
#337
Tragic
$32,996
Arapaho
0.0
/100
|
#338
Tragic
$32,345
Pueblo
0.0
/100
|
#339
Tragic
$32,012
Crow
0.0
/100
|
#340
Tragic
$31,729
Puerto Ricans
0.0
/100
|
#341
Tragic
$31,268
Hopi
0.0
/100
|
#342
Tragic
$31,177
Pima
0.0
/100
|
#343
Tragic
$30,644
Yup'ik
0.0
/100
|
#344
Tragic
$30,518
Tohono O'odham
0.0
/100
|
#345
Tragic
$30,256
Lumbee
0.0
/100
|
#346
Tragic
$29,845
Navajo
0.0
/100
|
#347
Tragic
$29,031

Demographics Similar to Immigrants from Spain by Per Capita Income

In terms of per capita income, the demographic groups most similar to Immigrants from Spain are Immigrants from Europe ($50,950, a difference of 0.030%), Immigrants from Latvia ($50,914, a difference of 0.040%), Bulgarian ($50,906, a difference of 0.050%), Immigrants from Serbia ($50,810, a difference of 0.24%), and New Zealander ($50,575, a difference of 0.71%).
DemographicsRating | RankPer Capita Income
Immigrants | Czechoslovakia
100.0
/100
|
#38
Exceptional
$51,770
Cambodians
100.0
/100
|
#39
Exceptional
$51,731
Immigrants | Korea
100.0
/100
|
#40
Exceptional
$51,671
Immigrants | South Africa
100.0
/100
|
#41
Exceptional
$51,465
Immigrants | Turkey
100.0
/100
|
#42
Exceptional
$51,368
Immigrants | Lithuania
100.0
/100
|
#43
Exceptional
$51,361
Immigrants | Europe
100.0
/100
|
#44
Exceptional
$50,950
Immigrants | Spain
100.0
/100
|
#45
Exceptional
$50,933
Immigrants | Latvia
100.0
/100
|
#46
Exceptional
$50,914
Bulgarians
100.0
/100
|
#47
Exceptional
$50,906
Immigrants | Serbia
100.0
/100
|
#48
Exceptional
$50,810
New Zealanders
100.0
/100
|
#49
Exceptional
$50,575
Immigrants | Sri Lanka
100.0
/100
|
#50
Exceptional
$50,555
Immigrants | Netherlands
100.0
/100
|
#51
Exceptional
$50,458
Immigrants | Croatia
99.9
/100
|
#52
Exceptional
$50,417