Tohono O'odham vs Chickasaw Median Female Earnings
COMPARE
Tohono O'odham
Chickasaw
Median Female Earnings
Median Female Earnings Comparison
Tohono O'odham
Chickasaw
$33,205
MEDIAN FEMALE EARNINGS
0.0/ 100
METRIC RATING
340th/ 347
METRIC RANK
$34,414
MEDIAN FEMALE EARNINGS
0.0/ 100
METRIC RATING
322nd/ 347
METRIC RANK
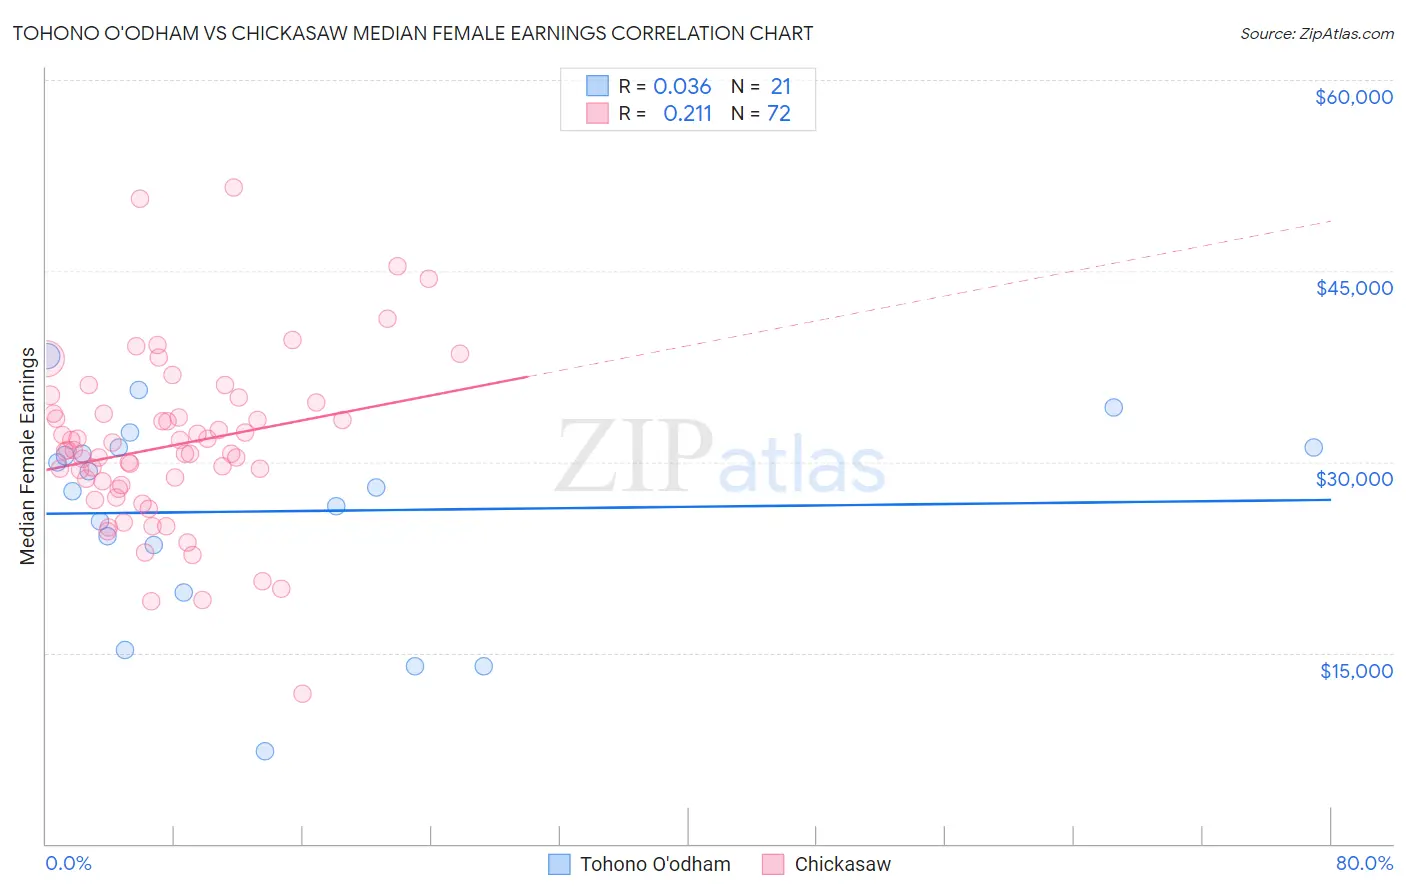
Tohono O'odham vs Chickasaw Median Female Earnings Correlation Chart
The statistical analysis conducted on geographies consisting of 58,716,616 people shows no correlation between the proportion of Tohono O'odham and median female earnings in the United States with a correlation coefficient (R) of 0.036 and weighted average of $33,205. Similarly, the statistical analysis conducted on geographies consisting of 147,680,530 people shows a weak positive correlation between the proportion of Chickasaw and median female earnings in the United States with a correlation coefficient (R) of 0.211 and weighted average of $34,414, a difference of 3.6%.
Median Female Earnings Correlation Summary
| Measurement | Tohono O'odham | Chickasaw |
| Minimum | $7,287 | $11,797 |
| Maximum | $38,345 | $51,543 |
| Range | $31,058 | $39,746 |
| Mean | $26,118 | $31,266 |
| Median | $28,033 | $30,877 |
| Interquartile 25% (IQ1) | $21,596 | $28,026 |
| Interquartile 75% (IQ3) | $31,136 | $33,779 |
| Interquartile Range (IQR) | $9,540 | $5,753 |
| Standard Deviation (Sample) | $8,020 | $6,735 |
| Standard Deviation (Population) | $7,826 | $6,688 |
Demographics Similar to Tohono O'odham and Chickasaw by Median Female Earnings
In terms of median female earnings, the demographic groups most similar to Tohono O'odham are Immigrants from Mexico ($33,236, a difference of 0.090%), Immigrants from Cuba ($33,291, a difference of 0.26%), Yakama ($33,354, a difference of 0.45%), Navajo ($33,046, a difference of 0.48%), and Ottawa ($33,378, a difference of 0.52%). Similarly, the demographic groups most similar to Chickasaw are Hispanic or Latino ($34,421, a difference of 0.020%), Seminole ($34,385, a difference of 0.080%), Immigrants from Congo ($34,317, a difference of 0.28%), Dutch West Indian ($34,106, a difference of 0.90%), and Kiowa ($34,074, a difference of 1.0%).
| Demographics | Rating | Rank | Median Female Earnings |
| Hispanics or Latinos | 0.0 /100 | #321 | Tragic $34,421 |
| Chickasaw | 0.0 /100 | #322 | Tragic $34,414 |
| Seminole | 0.0 /100 | #323 | Tragic $34,385 |
| Immigrants | Congo | 0.0 /100 | #324 | Tragic $34,317 |
| Dutch West Indians | 0.0 /100 | #325 | Tragic $34,106 |
| Kiowa | 0.0 /100 | #326 | Tragic $34,074 |
| Cajuns | 0.0 /100 | #327 | Tragic $34,034 |
| Immigrants | Central America | 0.0 /100 | #328 | Tragic $33,953 |
| Hopi | 0.0 /100 | #329 | Tragic $33,932 |
| Menominee | 0.0 /100 | #330 | Tragic $33,894 |
| Natives/Alaskans | 0.0 /100 | #331 | Tragic $33,806 |
| Choctaw | 0.0 /100 | #332 | Tragic $33,775 |
| Mexicans | 0.0 /100 | #333 | Tragic $33,664 |
| Spanish American Indians | 0.0 /100 | #334 | Tragic $33,625 |
| Creek | 0.0 /100 | #335 | Tragic $33,437 |
| Ottawa | 0.0 /100 | #336 | Tragic $33,378 |
| Yakama | 0.0 /100 | #337 | Tragic $33,354 |
| Immigrants | Cuba | 0.0 /100 | #338 | Tragic $33,291 |
| Immigrants | Mexico | 0.0 /100 | #339 | Tragic $33,236 |
| Tohono O'odham | 0.0 /100 | #340 | Tragic $33,205 |
| Navajo | 0.0 /100 | #341 | Tragic $33,046 |