Tohono O'odham vs Belgian Householder Income Ages 45 - 64 years
COMPARE
Tohono O'odham
Belgian
Householder Income Ages 45 - 64 years
Householder Income Ages 45 - 64 years Comparison
Tohono O'odham
Belgians
$73,774
HOUSEHOLDER INCOME AGES 45 - 64 YEARS
0.0/ 100
METRIC RATING
342nd/ 347
METRIC RANK
$100,060
HOUSEHOLDER INCOME AGES 45 - 64 YEARS
46.7/ 100
METRIC RATING
179th/ 347
METRIC RANK
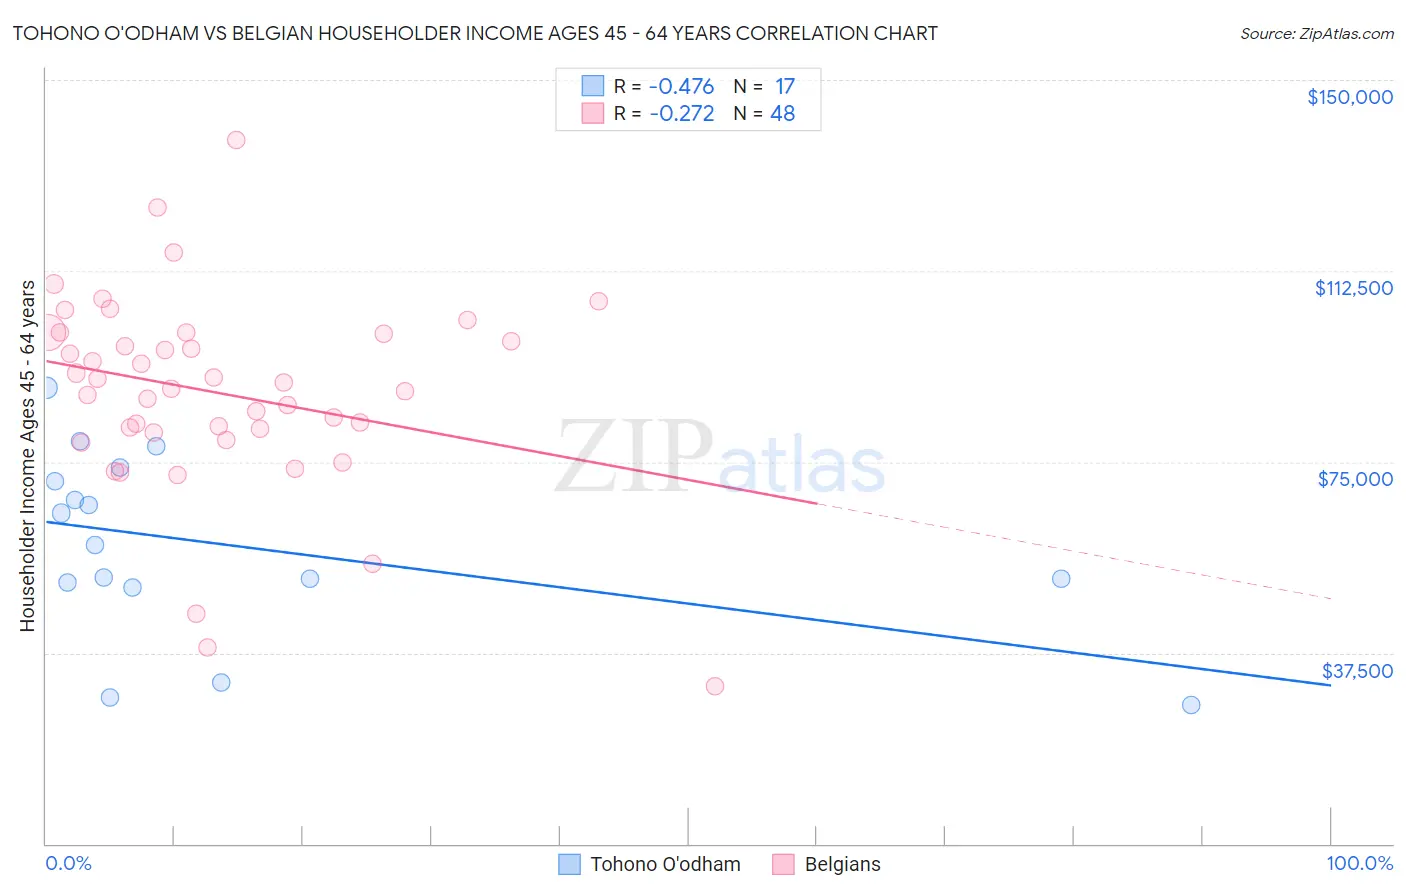
Tohono O'odham vs Belgian Householder Income Ages 45 - 64 years Correlation Chart
The statistical analysis conducted on geographies consisting of 58,700,598 people shows a moderate negative correlation between the proportion of Tohono O'odham and household income with householder between the ages 45 and 64 in the United States with a correlation coefficient (R) of -0.476 and weighted average of $73,774. Similarly, the statistical analysis conducted on geographies consisting of 355,498,579 people shows a weak negative correlation between the proportion of Belgians and household income with householder between the ages 45 and 64 in the United States with a correlation coefficient (R) of -0.272 and weighted average of $100,060, a difference of 35.6%.
Householder Income Ages 45 - 64 years Correlation Summary
| Measurement | Tohono O'odham | Belgian |
| Minimum | $27,250 | $30,833 |
| Maximum | $89,534 | $138,162 |
| Range | $62,284 | $107,329 |
| Mean | $58,522 | $88,608 |
| Median | $58,558 | $89,979 |
| Interquartile 25% (IQ1) | $50,712 | $81,216 |
| Interquartile 75% (IQ3) | $72,531 | $100,318 |
| Interquartile Range (IQR) | $21,819 | $19,101 |
| Standard Deviation (Sample) | $18,007 | $19,546 |
| Standard Deviation (Population) | $17,469 | $19,341 |
Similar Demographics by Householder Income Ages 45 - 64 years
Demographics Similar to Tohono O'odham by Householder Income Ages 45 - 64 years
In terms of householder income ages 45 - 64 years, the demographic groups most similar to Tohono O'odham are Pima ($73,365, a difference of 0.56%), Crow ($74,257, a difference of 0.65%), Immigrants from Yemen ($74,575, a difference of 1.1%), Kiowa ($74,815, a difference of 1.4%), and Houma ($72,093, a difference of 2.3%).
| Demographics | Rating | Rank | Householder Income Ages 45 - 64 years |
| Immigrants | Congo | 0.0 /100 | #333 | Tragic $77,850 |
| Menominee | 0.0 /100 | #334 | Tragic $76,903 |
| Cheyenne | 0.0 /100 | #335 | Tragic $76,362 |
| Arapaho | 0.0 /100 | #336 | Tragic $75,945 |
| Pueblo | 0.0 /100 | #337 | Tragic $75,601 |
| Hopi | 0.0 /100 | #338 | Tragic $75,562 |
| Kiowa | 0.0 /100 | #339 | Tragic $74,815 |
| Immigrants | Yemen | 0.0 /100 | #340 | Tragic $74,575 |
| Crow | 0.0 /100 | #341 | Tragic $74,257 |
| Tohono O'odham | 0.0 /100 | #342 | Tragic $73,774 |
| Pima | 0.0 /100 | #343 | Tragic $73,365 |
| Houma | 0.0 /100 | #344 | Tragic $72,093 |
| Navajo | 0.0 /100 | #345 | Tragic $69,759 |
| Puerto Ricans | 0.0 /100 | #346 | Tragic $69,234 |
| Lumbee | 0.0 /100 | #347 | Tragic $65,113 |
Demographics Similar to Belgians by Householder Income Ages 45 - 64 years
In terms of householder income ages 45 - 64 years, the demographic groups most similar to Belgians are Aleut ($100,052, a difference of 0.010%), Immigrants from Cameroon ($100,084, a difference of 0.020%), Immigrants from Costa Rica ($100,141, a difference of 0.080%), Moroccan ($100,138, a difference of 0.080%), and Immigrants ($99,943, a difference of 0.12%).
| Demographics | Rating | Rank | Householder Income Ages 45 - 64 years |
| Immigrants | Uzbekistan | 52.5 /100 | #172 | Average $100,523 |
| Alsatians | 51.4 /100 | #173 | Average $100,435 |
| Welsh | 50.0 /100 | #174 | Average $100,322 |
| Germans | 48.8 /100 | #175 | Average $100,224 |
| Immigrants | Costa Rica | 47.7 /100 | #176 | Average $100,141 |
| Moroccans | 47.7 /100 | #177 | Average $100,138 |
| Immigrants | Cameroon | 47.0 /100 | #178 | Average $100,084 |
| Belgians | 46.7 /100 | #179 | Average $100,060 |
| Aleuts | 46.6 /100 | #180 | Average $100,052 |
| Immigrants | Immigrants | 45.3 /100 | #181 | Average $99,943 |
| Finns | 44.8 /100 | #182 | Average $99,904 |
| Spaniards | 44.6 /100 | #183 | Average $99,889 |
| French | 43.8 /100 | #184 | Average $99,824 |
| Colombians | 43.2 /100 | #185 | Average $99,772 |
| Dutch | 41.7 /100 | #186 | Average $99,650 |