Tlingit-Haida vs Bolivian Median Family Income
COMPARE
Tlingit-Haida
Bolivian
Median Family Income
Median Family Income Comparison
Tlingit-Haida
Bolivians
$101,092
MEDIAN FAMILY INCOME
30.8/ 100
METRIC RATING
187th/ 347
METRIC RANK
$119,479
MEDIAN FAMILY INCOME
100.0/ 100
METRIC RATING
34th/ 347
METRIC RANK
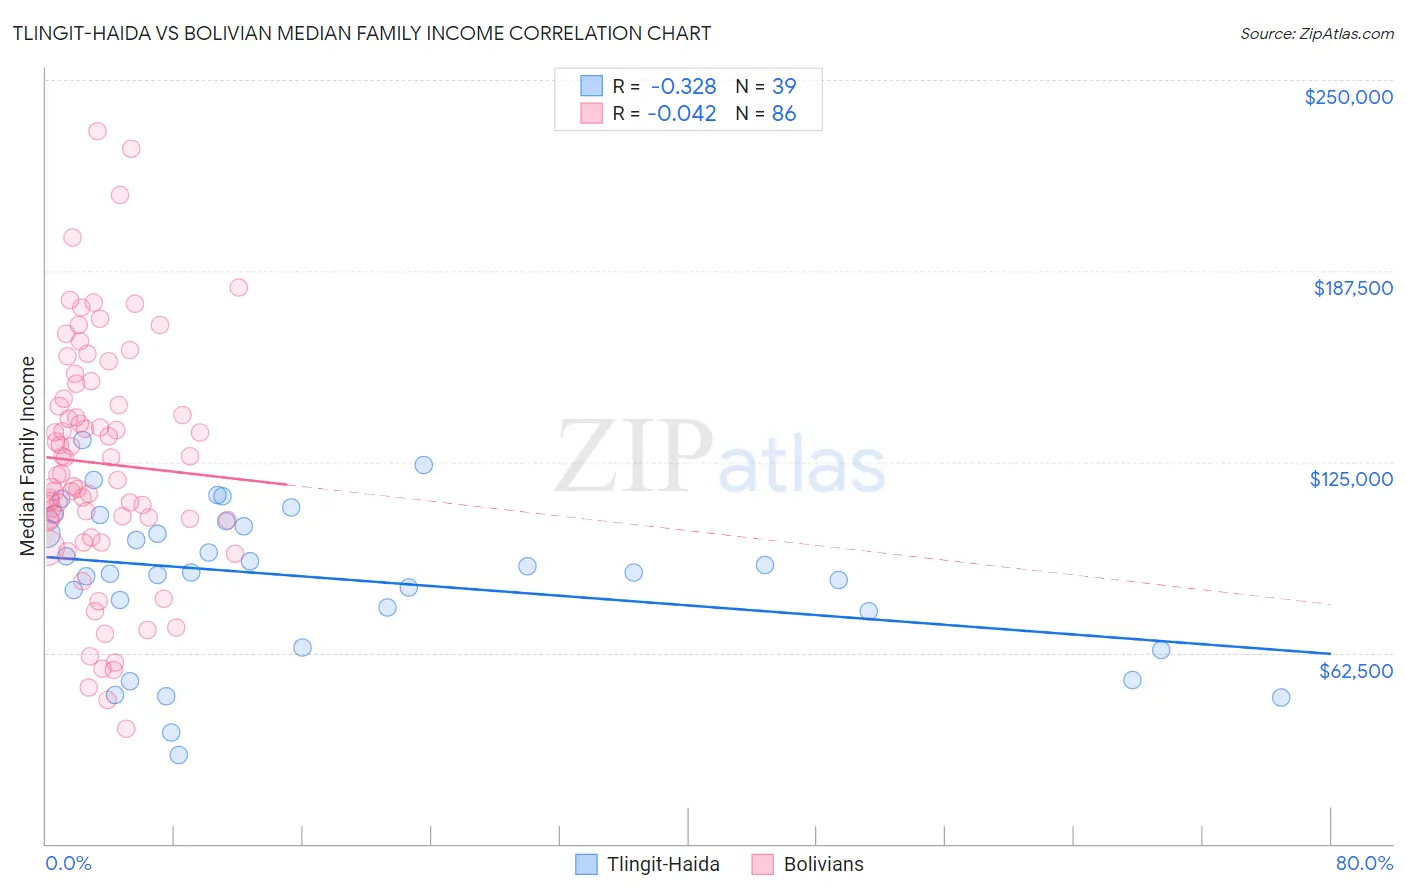
Tlingit-Haida vs Bolivian Median Family Income Correlation Chart
The statistical analysis conducted on geographies consisting of 60,853,273 people shows a mild negative correlation between the proportion of Tlingit-Haida and median family income in the United States with a correlation coefficient (R) of -0.328 and weighted average of $101,092. Similarly, the statistical analysis conducted on geographies consisting of 184,605,478 people shows no correlation between the proportion of Bolivians and median family income in the United States with a correlation coefficient (R) of -0.042 and weighted average of $119,479, a difference of 18.2%.
Median Family Income Correlation Summary
| Measurement | Tlingit-Haida | Bolivian |
| Minimum | $29,250 | $37,679 |
| Maximum | $132,184 | $233,276 |
| Range | $102,934 | $195,597 |
| Mean | $86,951 | $124,569 |
| Median | $88,958 | $120,978 |
| Interquartile 25% (IQ1) | $75,972 | $106,050 |
| Interquartile 75% (IQ3) | $105,493 | $145,603 |
| Interquartile Range (IQR) | $29,521 | $39,553 |
| Standard Deviation (Sample) | $24,804 | $39,306 |
| Standard Deviation (Population) | $24,484 | $39,077 |
Similar Demographics by Median Family Income
Demographics Similar to Tlingit-Haida by Median Family Income
In terms of median family income, the demographic groups most similar to Tlingit-Haida are Guamanian/Chamorro ($101,061, a difference of 0.030%), Celtic ($101,139, a difference of 0.050%), Dutch ($101,192, a difference of 0.10%), Immigrants from Portugal ($100,984, a difference of 0.11%), and Immigrants ($100,962, a difference of 0.13%).
| Demographics | Rating | Rank | Median Family Income |
| French Canadians | 37.0 /100 | #180 | Fair $101,634 |
| Spaniards | 36.8 /100 | #181 | Fair $101,617 |
| Tsimshian | 35.9 /100 | #182 | Fair $101,543 |
| Kenyans | 34.5 /100 | #183 | Fair $101,417 |
| Immigrants | Costa Rica | 33.7 /100 | #184 | Fair $101,354 |
| Dutch | 31.9 /100 | #185 | Fair $101,192 |
| Celtics | 31.3 /100 | #186 | Fair $101,139 |
| Tlingit-Haida | 30.8 /100 | #187 | Fair $101,092 |
| Guamanians/Chamorros | 30.5 /100 | #188 | Fair $101,061 |
| Immigrants | Portugal | 29.6 /100 | #189 | Fair $100,984 |
| Immigrants | Immigrants | 29.4 /100 | #190 | Fair $100,962 |
| Colombians | 27.2 /100 | #191 | Fair $100,750 |
| Immigrants | Kenya | 26.5 /100 | #192 | Fair $100,679 |
| Iraqis | 26.3 /100 | #193 | Fair $100,658 |
| Uruguayans | 26.3 /100 | #194 | Fair $100,656 |
Demographics Similar to Bolivians by Median Family Income
In terms of median family income, the demographic groups most similar to Bolivians are Soviet Union ($119,262, a difference of 0.18%), Bhutanese ($119,800, a difference of 0.27%), Asian ($119,955, a difference of 0.40%), Immigrants from France ($120,076, a difference of 0.50%), and Immigrants from Sri Lanka ($120,263, a difference of 0.66%).
| Demographics | Rating | Rank | Median Family Income |
| Russians | 100.0 /100 | #27 | Exceptional $120,487 |
| Immigrants | Denmark | 100.0 /100 | #28 | Exceptional $120,445 |
| Latvians | 100.0 /100 | #29 | Exceptional $120,301 |
| Immigrants | Sri Lanka | 100.0 /100 | #30 | Exceptional $120,263 |
| Immigrants | France | 100.0 /100 | #31 | Exceptional $120,076 |
| Asians | 100.0 /100 | #32 | Exceptional $119,955 |
| Bhutanese | 100.0 /100 | #33 | Exceptional $119,800 |
| Bolivians | 100.0 /100 | #34 | Exceptional $119,479 |
| Soviet Union | 100.0 /100 | #35 | Exceptional $119,262 |
| Israelis | 100.0 /100 | #36 | Exceptional $118,577 |
| Australians | 100.0 /100 | #37 | Exceptional $118,440 |
| Immigrants | Turkey | 100.0 /100 | #38 | Exceptional $118,325 |
| Immigrants | Asia | 100.0 /100 | #39 | Exceptional $118,291 |
| Immigrants | Lithuania | 100.0 /100 | #40 | Exceptional $118,053 |
| Estonians | 100.0 /100 | #41 | Exceptional $118,013 |