Spaniard vs Costa Rican Median Female Earnings
COMPARE
Spaniard
Costa Rican
Median Female Earnings
Median Female Earnings Comparison
Spaniards
Costa Ricans
$38,656
MEDIAN FEMALE EARNINGS
10.3/ 100
METRIC RATING
215th/ 347
METRIC RANK
$39,622
MEDIAN FEMALE EARNINGS
46.1/ 100
METRIC RATING
177th/ 347
METRIC RANK
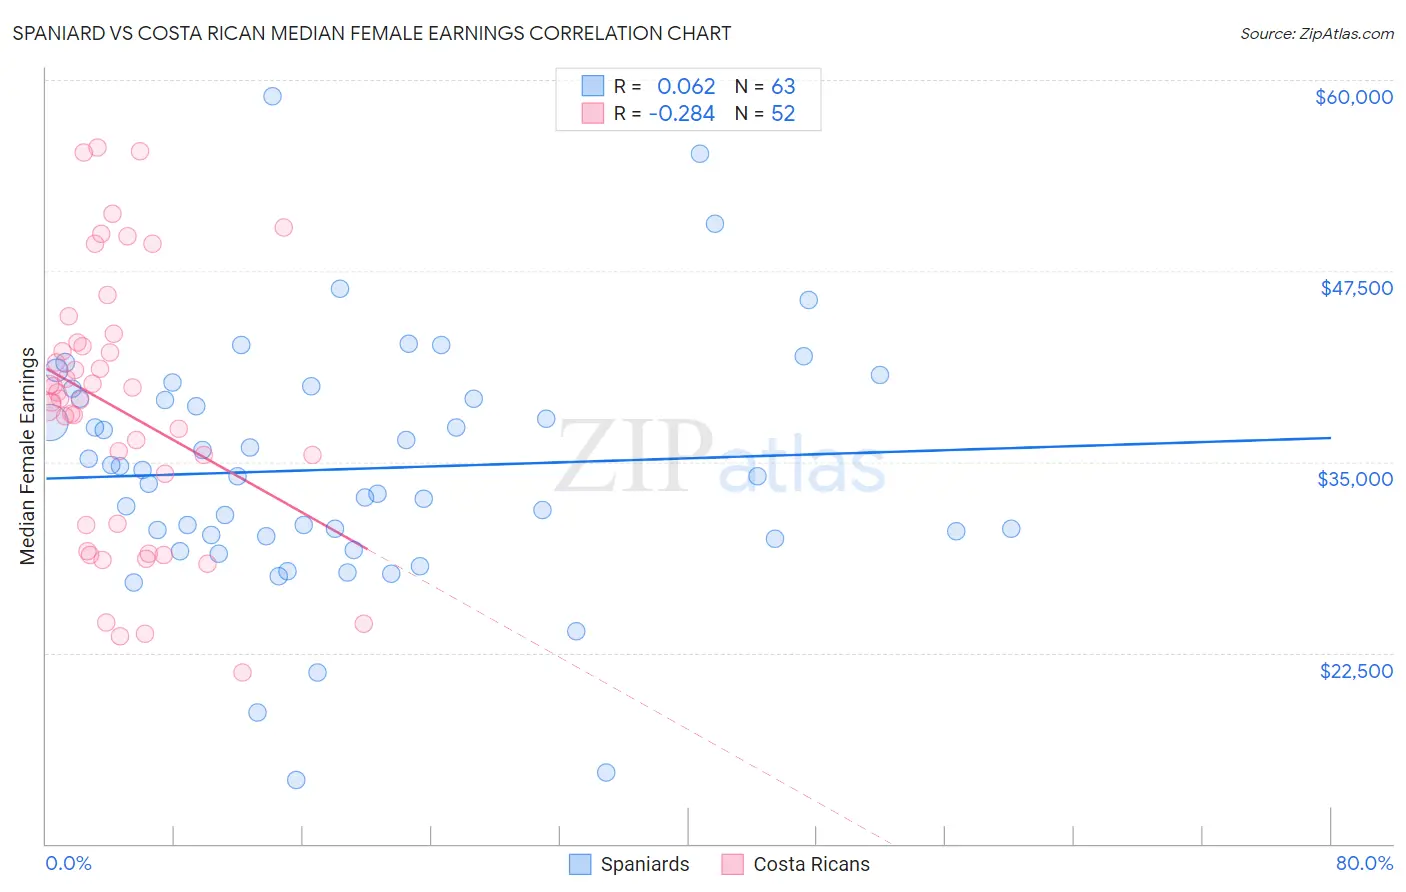
Spaniard vs Costa Rican Median Female Earnings Correlation Chart
The statistical analysis conducted on geographies consisting of 443,223,610 people shows a slight positive correlation between the proportion of Spaniards and median female earnings in the United States with a correlation coefficient (R) of 0.062 and weighted average of $38,656. Similarly, the statistical analysis conducted on geographies consisting of 253,570,607 people shows a weak negative correlation between the proportion of Costa Ricans and median female earnings in the United States with a correlation coefficient (R) of -0.284 and weighted average of $39,622, a difference of 2.5%.
Median Female Earnings Correlation Summary
| Measurement | Spaniard | Costa Rican |
| Minimum | $14,192 | $21,250 |
| Maximum | $58,909 | $55,551 |
| Range | $44,717 | $34,301 |
| Mean | $34,527 | $38,430 |
| Median | $34,038 | $39,100 |
| Interquartile 25% (IQ1) | $30,169 | $30,898 |
| Interquartile 75% (IQ3) | $39,139 | $42,674 |
| Interquartile Range (IQR) | $8,970 | $11,776 |
| Standard Deviation (Sample) | $8,078 | $8,659 |
| Standard Deviation (Population) | $8,014 | $8,575 |
Similar Demographics by Median Female Earnings
Demographics Similar to Spaniards by Median Female Earnings
In terms of median female earnings, the demographic groups most similar to Spaniards are Iraqi ($38,666, a difference of 0.020%), Jamaican ($38,670, a difference of 0.030%), Immigrants from Ecuador ($38,644, a difference of 0.030%), Immigrants from Jamaica ($38,625, a difference of 0.080%), and Cape Verdean ($38,614, a difference of 0.11%).
| Demographics | Rating | Rank | Median Female Earnings |
| Immigrants | Thailand | 13.6 /100 | #208 | Poor $38,810 |
| Norwegians | 13.4 /100 | #209 | Poor $38,802 |
| Czechoslovakians | 12.0 /100 | #210 | Poor $38,738 |
| Aleuts | 11.6 /100 | #211 | Poor $38,719 |
| Guamanians/Chamorros | 11.5 /100 | #212 | Poor $38,717 |
| Jamaicans | 10.5 /100 | #213 | Poor $38,670 |
| Iraqis | 10.5 /100 | #214 | Poor $38,666 |
| Spaniards | 10.3 /100 | #215 | Poor $38,656 |
| Immigrants | Ecuador | 10.1 /100 | #216 | Poor $38,644 |
| Immigrants | Jamaica | 9.7 /100 | #217 | Tragic $38,625 |
| Cape Verdeans | 9.5 /100 | #218 | Tragic $38,614 |
| Nepalese | 9.3 /100 | #219 | Tragic $38,603 |
| Yugoslavians | 8.8 /100 | #220 | Tragic $38,573 |
| Immigrants | Azores | 8.8 /100 | #221 | Tragic $38,573 |
| Japanese | 8.1 /100 | #222 | Tragic $38,528 |
Demographics Similar to Costa Ricans by Median Female Earnings
In terms of median female earnings, the demographic groups most similar to Costa Ricans are Slavic ($39,613, a difference of 0.020%), Immigrants from South America ($39,643, a difference of 0.050%), Nigerian ($39,641, a difference of 0.050%), Immigrants from Germany ($39,603, a difference of 0.050%), and South American ($39,698, a difference of 0.19%).
| Demographics | Rating | Rank | Median Female Earnings |
| Slovenes | 56.2 /100 | #170 | Average $39,817 |
| Immigrants | Portugal | 54.7 /100 | #171 | Average $39,788 |
| British | 53.8 /100 | #172 | Average $39,772 |
| Canadians | 51.4 /100 | #173 | Average $39,724 |
| South Americans | 50.0 /100 | #174 | Average $39,698 |
| Immigrants | South America | 47.2 /100 | #175 | Average $39,643 |
| Nigerians | 47.0 /100 | #176 | Average $39,641 |
| Costa Ricans | 46.1 /100 | #177 | Average $39,622 |
| Slavs | 45.6 /100 | #178 | Average $39,613 |
| Immigrants | Germany | 45.1 /100 | #179 | Average $39,603 |
| Immigrants | Kenya | 41.6 /100 | #180 | Average $39,535 |
| Tsimshian | 41.4 /100 | #181 | Average $39,530 |
| Tlingit-Haida | 40.5 /100 | #182 | Average $39,513 |
| Hungarians | 40.3 /100 | #183 | Average $39,510 |
| Europeans | 37.7 /100 | #184 | Fair $39,457 |