Immigrants from Western Africa vs Costa Rican Median Female Earnings
COMPARE
Immigrants from Western Africa
Costa Rican
Median Female Earnings
Median Female Earnings Comparison
Immigrants from Western Africa
Costa Ricans
$39,351
MEDIAN FEMALE EARNINGS
32.7/ 100
METRIC RATING
191st/ 347
METRIC RANK
$39,622
MEDIAN FEMALE EARNINGS
46.1/ 100
METRIC RATING
177th/ 347
METRIC RANK
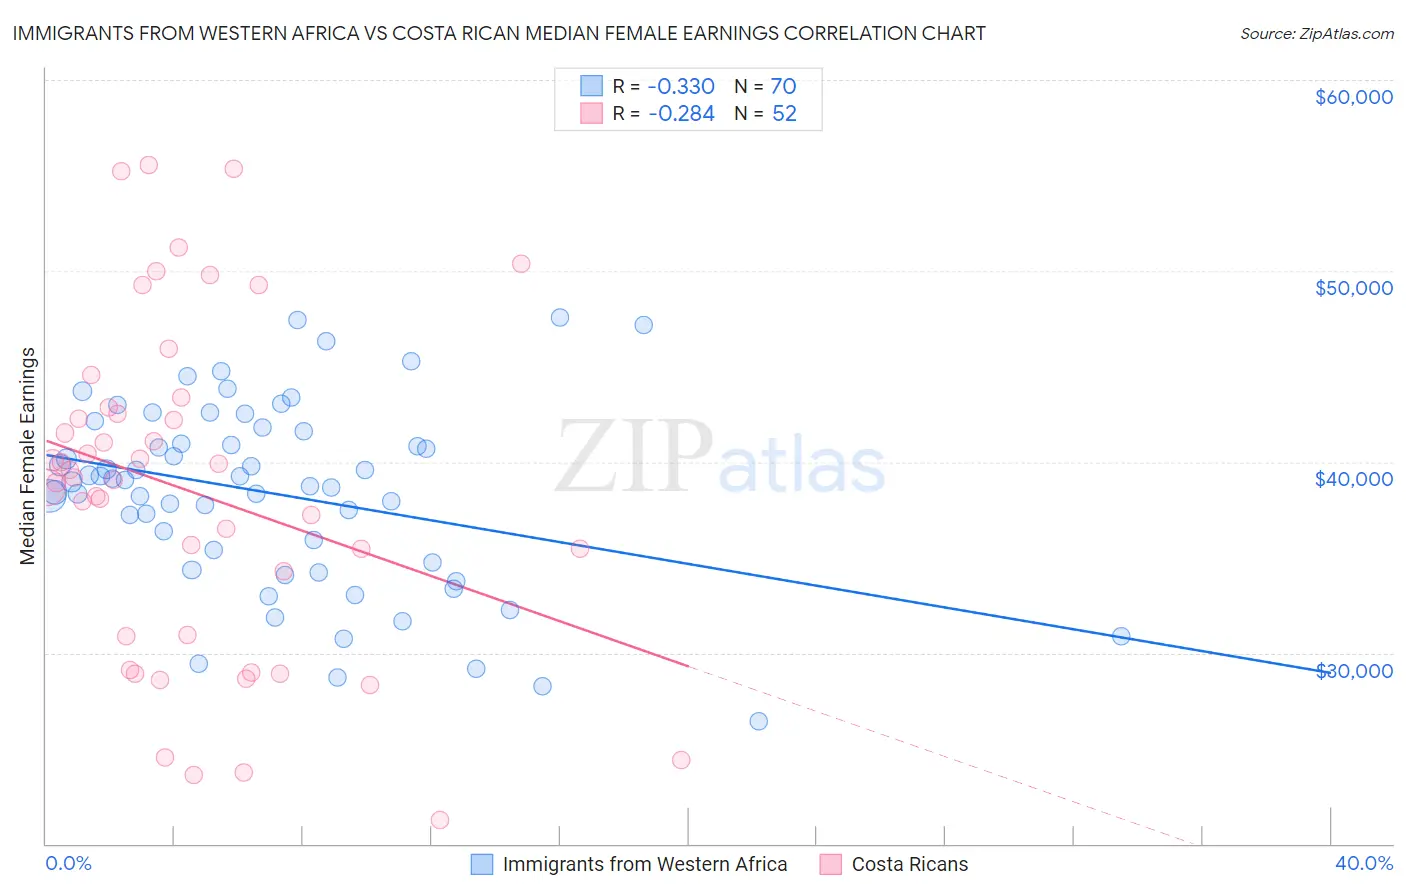
Immigrants from Western Africa vs Costa Rican Median Female Earnings Correlation Chart
The statistical analysis conducted on geographies consisting of 357,790,010 people shows a mild negative correlation between the proportion of Immigrants from Western Africa and median female earnings in the United States with a correlation coefficient (R) of -0.330 and weighted average of $39,351. Similarly, the statistical analysis conducted on geographies consisting of 253,570,607 people shows a weak negative correlation between the proportion of Costa Ricans and median female earnings in the United States with a correlation coefficient (R) of -0.284 and weighted average of $39,622, a difference of 0.69%.
Median Female Earnings Correlation Summary
| Measurement | Immigrants from Western Africa | Costa Rican |
| Minimum | $26,446 | $21,250 |
| Maximum | $47,567 | $55,551 |
| Range | $21,121 | $34,301 |
| Mean | $38,325 | $38,430 |
| Median | $39,007 | $39,100 |
| Interquartile 25% (IQ1) | $34,756 | $30,898 |
| Interquartile 75% (IQ3) | $41,620 | $42,674 |
| Interquartile Range (IQR) | $6,864 | $11,776 |
| Standard Deviation (Sample) | $4,866 | $8,659 |
| Standard Deviation (Population) | $4,831 | $8,575 |
Demographics Similar to Immigrants from Western Africa and Costa Ricans by Median Female Earnings
In terms of median female earnings, the demographic groups most similar to Immigrants from Western Africa are Puget Sound Salish ($39,376, a difference of 0.060%), Immigrants ($39,328, a difference of 0.060%), Senegalese ($39,384, a difference of 0.080%), Immigrants from Nigeria ($39,294, a difference of 0.14%), and Irish ($39,291, a difference of 0.15%). Similarly, the demographic groups most similar to Costa Ricans are Slavic ($39,613, a difference of 0.020%), Immigrants from South America ($39,643, a difference of 0.050%), Nigerian ($39,641, a difference of 0.050%), Immigrants from Germany ($39,603, a difference of 0.050%), and South American ($39,698, a difference of 0.19%).
| Demographics | Rating | Rank | Median Female Earnings |
| South Americans | 50.0 /100 | #174 | Average $39,698 |
| Immigrants | South America | 47.2 /100 | #175 | Average $39,643 |
| Nigerians | 47.0 /100 | #176 | Average $39,641 |
| Costa Ricans | 46.1 /100 | #177 | Average $39,622 |
| Slavs | 45.6 /100 | #178 | Average $39,613 |
| Immigrants | Germany | 45.1 /100 | #179 | Average $39,603 |
| Immigrants | Kenya | 41.6 /100 | #180 | Average $39,535 |
| Tsimshian | 41.4 /100 | #181 | Average $39,530 |
| Tlingit-Haida | 40.5 /100 | #182 | Average $39,513 |
| Hungarians | 40.3 /100 | #183 | Average $39,510 |
| Europeans | 37.7 /100 | #184 | Fair $39,457 |
| Immigrants | West Indies | 36.9 /100 | #185 | Fair $39,441 |
| Colombians | 36.9 /100 | #186 | Fair $39,439 |
| Swedes | 36.0 /100 | #187 | Fair $39,421 |
| Bermudans | 35.9 /100 | #188 | Fair $39,418 |
| Senegalese | 34.2 /100 | #189 | Fair $39,384 |
| Puget Sound Salish | 33.9 /100 | #190 | Fair $39,376 |
| Immigrants | Western Africa | 32.7 /100 | #191 | Fair $39,351 |
| Immigrants | Immigrants | 31.7 /100 | #192 | Fair $39,328 |
| Immigrants | Nigeria | 30.2 /100 | #193 | Fair $39,294 |
| Irish | 30.0 /100 | #194 | Fair $39,291 |