Soviet Union vs Uruguayan Median Male Earnings
COMPARE
Soviet Union
Uruguayan
Median Male Earnings
Median Male Earnings Comparison
Soviet Union
Uruguayans
$63,382
MEDIAN MALE EARNINGS
100.0/ 100
METRIC RATING
32nd/ 347
METRIC RANK
$53,680
MEDIAN MALE EARNINGS
31.1/ 100
METRIC RATING
190th/ 347
METRIC RANK
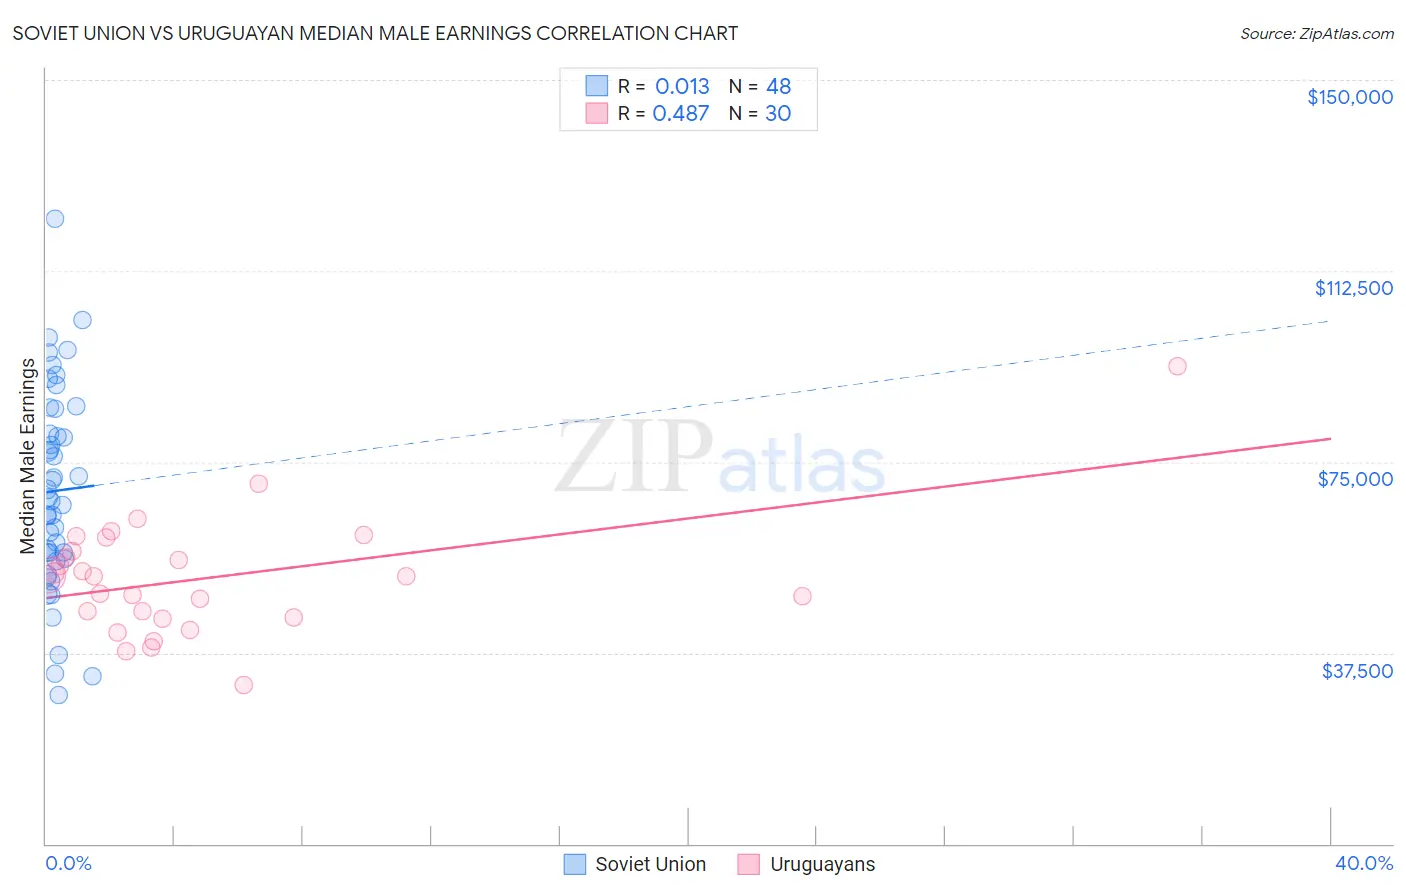
Soviet Union vs Uruguayan Median Male Earnings Correlation Chart
The statistical analysis conducted on geographies consisting of 43,507,869 people shows no correlation between the proportion of Soviet Union and median male earnings in the United States with a correlation coefficient (R) of 0.013 and weighted average of $63,382. Similarly, the statistical analysis conducted on geographies consisting of 144,776,277 people shows a moderate positive correlation between the proportion of Uruguayans and median male earnings in the United States with a correlation coefficient (R) of 0.487 and weighted average of $53,680, a difference of 18.1%.
Median Male Earnings Correlation Summary
| Measurement | Soviet Union | Uruguayan |
| Minimum | $29,197 | $31,250 |
| Maximum | $122,813 | $93,710 |
| Range | $93,616 | $62,460 |
| Mean | $69,321 | $52,178 |
| Median | $67,564 | $52,491 |
| Interquartile 25% (IQ1) | $56,498 | $44,514 |
| Interquartile 75% (IQ3) | $82,953 | $57,550 |
| Interquartile Range (IQR) | $26,455 | $13,036 |
| Standard Deviation (Sample) | $19,957 | $11,765 |
| Standard Deviation (Population) | $19,748 | $11,568 |
Similar Demographics by Median Male Earnings
Demographics Similar to Soviet Union by Median Male Earnings
In terms of median male earnings, the demographic groups most similar to Soviet Union are Immigrants from Lithuania ($63,346, a difference of 0.060%), Immigrants from Russia ($63,326, a difference of 0.090%), Latvian ($63,498, a difference of 0.18%), Immigrants from Asia ($63,240, a difference of 0.22%), and Israeli ($63,228, a difference of 0.24%).
| Demographics | Rating | Rank | Median Male Earnings |
| Immigrants | Denmark | 100.0 /100 | #25 | Exceptional $64,625 |
| Turks | 100.0 /100 | #26 | Exceptional $64,253 |
| Immigrants | Switzerland | 100.0 /100 | #27 | Exceptional $63,944 |
| Russians | 100.0 /100 | #28 | Exceptional $63,939 |
| Asians | 100.0 /100 | #29 | Exceptional $63,827 |
| Immigrants | France | 100.0 /100 | #30 | Exceptional $63,715 |
| Latvians | 100.0 /100 | #31 | Exceptional $63,498 |
| Soviet Union | 100.0 /100 | #32 | Exceptional $63,382 |
| Immigrants | Lithuania | 100.0 /100 | #33 | Exceptional $63,346 |
| Immigrants | Russia | 100.0 /100 | #34 | Exceptional $63,326 |
| Immigrants | Asia | 100.0 /100 | #35 | Exceptional $63,240 |
| Israelis | 100.0 /100 | #36 | Exceptional $63,228 |
| Immigrants | Sri Lanka | 100.0 /100 | #37 | Exceptional $63,099 |
| Maltese | 100.0 /100 | #38 | Exceptional $62,953 |
| Immigrants | South Africa | 100.0 /100 | #39 | Exceptional $62,899 |
Demographics Similar to Uruguayans by Median Male Earnings
In terms of median male earnings, the demographic groups most similar to Uruguayans are Puget Sound Salish ($53,704, a difference of 0.040%), Guamanian/Chamorro ($53,661, a difference of 0.040%), Scotch-Irish ($53,658, a difference of 0.040%), Immigrants from Eritrea ($53,715, a difference of 0.060%), and Immigrants from Eastern Africa ($53,713, a difference of 0.060%).
| Demographics | Rating | Rank | Median Male Earnings |
| Immigrants | South America | 37.3 /100 | #183 | Fair $53,962 |
| Whites/Caucasians | 36.5 /100 | #184 | Fair $53,925 |
| Immigrants | Sierra Leone | 36.0 /100 | #185 | Fair $53,905 |
| Colombians | 34.4 /100 | #186 | Fair $53,832 |
| Immigrants | Eritrea | 31.8 /100 | #187 | Fair $53,715 |
| Immigrants | Eastern Africa | 31.8 /100 | #188 | Fair $53,713 |
| Puget Sound Salish | 31.6 /100 | #189 | Fair $53,704 |
| Uruguayans | 31.1 /100 | #190 | Fair $53,680 |
| Guamanians/Chamorros | 30.7 /100 | #191 | Fair $53,661 |
| Scotch-Irish | 30.6 /100 | #192 | Fair $53,658 |
| Kenyans | 30.4 /100 | #193 | Fair $53,647 |
| Spanish | 29.0 /100 | #194 | Fair $53,576 |
| Immigrants | Azores | 27.5 /100 | #195 | Fair $53,503 |
| Immigrants | Africa | 26.6 /100 | #196 | Fair $53,457 |
| Immigrants | Kenya | 26.0 /100 | #197 | Fair $53,427 |