South American vs Kenyan Per Capita Income
COMPARE
South American
Kenyan
Per Capita Income
Per Capita Income Comparison
South Americans
Kenyans
$44,114
PER CAPITA INCOME
62.4/ 100
METRIC RATING
159th/ 347
METRIC RANK
$42,808
PER CAPITA INCOME
27.7/ 100
METRIC RATING
190th/ 347
METRIC RANK
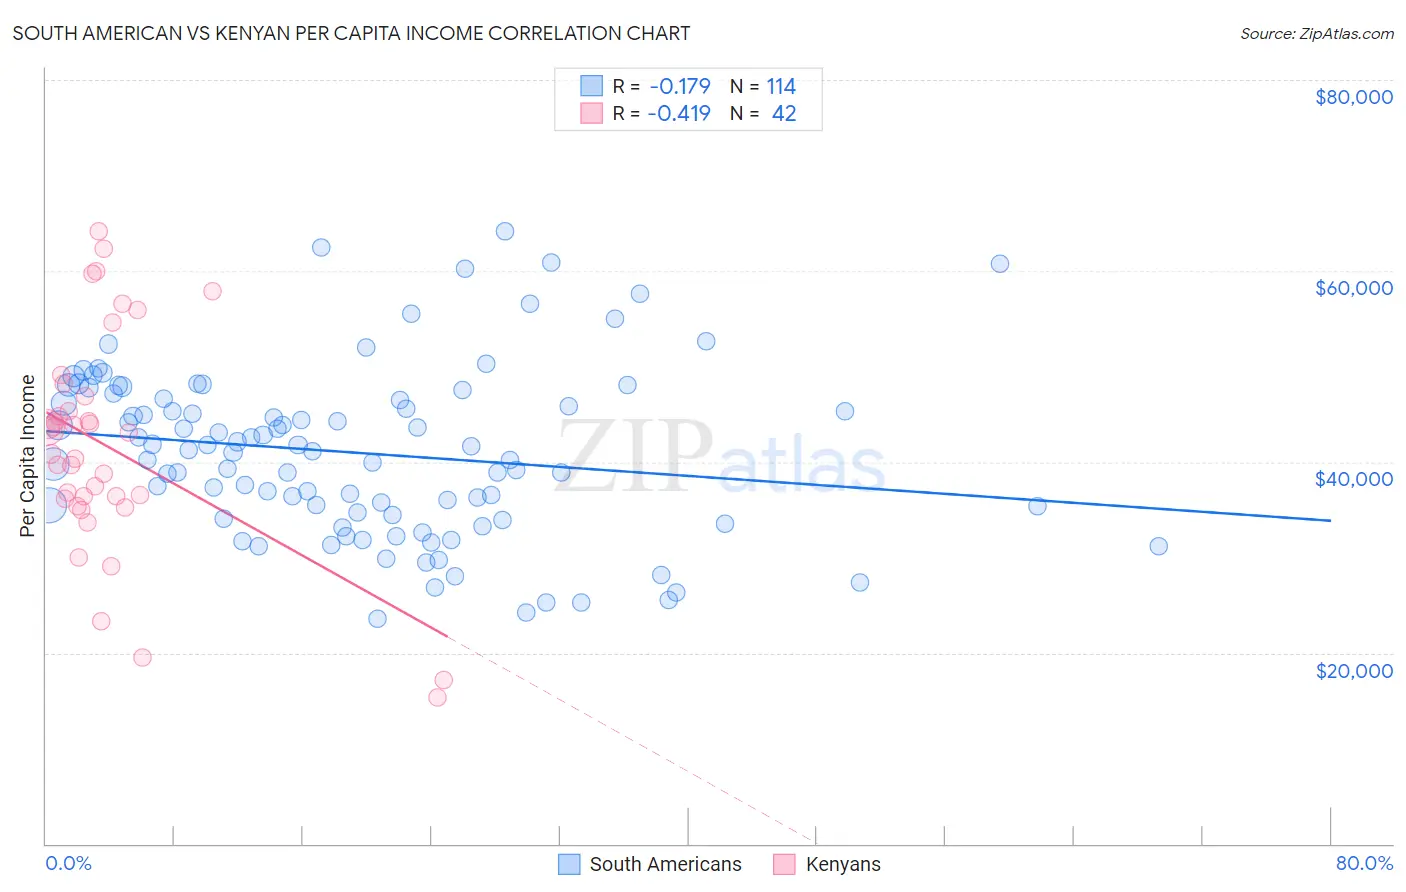
South American vs Kenyan Per Capita Income Correlation Chart
The statistical analysis conducted on geographies consisting of 494,145,698 people shows a poor negative correlation between the proportion of South Americans and per capita income in the United States with a correlation coefficient (R) of -0.179 and weighted average of $44,114. Similarly, the statistical analysis conducted on geographies consisting of 168,245,574 people shows a moderate negative correlation between the proportion of Kenyans and per capita income in the United States with a correlation coefficient (R) of -0.419 and weighted average of $42,808, a difference of 3.0%.
Per Capita Income Correlation Summary
| Measurement | South American | Kenyan |
| Minimum | $23,579 | $15,366 |
| Maximum | $64,213 | $64,188 |
| Range | $40,635 | $48,822 |
| Mean | $40,955 | $41,624 |
| Median | $41,221 | $42,003 |
| Interquartile 25% (IQ1) | $34,406 | $36,158 |
| Interquartile 75% (IQ3) | $46,619 | $46,865 |
| Interquartile Range (IQR) | $12,213 | $10,707 |
| Standard Deviation (Sample) | $8,864 | $11,486 |
| Standard Deviation (Population) | $8,825 | $11,348 |
Similar Demographics by Per Capita Income
Demographics Similar to South Americans by Per Capita Income
In terms of per capita income, the demographic groups most similar to South Americans are Danish ($44,095, a difference of 0.040%), Costa Rican ($44,090, a difference of 0.050%), Swiss ($44,076, a difference of 0.090%), Immigrants from South America ($44,068, a difference of 0.10%), and Immigrants from Nepal ($44,187, a difference of 0.17%).
| Demographics | Rating | Rank | Per Capita Income |
| Peruvians | 71.5 /100 | #152 | Good $44,479 |
| Scottish | 70.6 /100 | #153 | Good $44,440 |
| Portuguese | 68.7 /100 | #154 | Good $44,362 |
| Uruguayans | 67.6 /100 | #155 | Good $44,318 |
| Slovaks | 65.4 /100 | #156 | Good $44,229 |
| South American Indians | 64.8 /100 | #157 | Good $44,206 |
| Immigrants | Nepal | 64.3 /100 | #158 | Good $44,187 |
| South Americans | 62.4 /100 | #159 | Good $44,114 |
| Danes | 61.9 /100 | #160 | Good $44,095 |
| Costa Ricans | 61.8 /100 | #161 | Good $44,090 |
| Swiss | 61.4 /100 | #162 | Good $44,076 |
| Immigrants | South America | 61.2 /100 | #163 | Good $44,068 |
| Sri Lankans | 59.8 /100 | #164 | Average $44,014 |
| Immigrants | Philippines | 59.4 /100 | #165 | Average $44,000 |
| Immigrants | Uruguay | 59.3 /100 | #166 | Average $43,997 |
Demographics Similar to Kenyans by Per Capita Income
In terms of per capita income, the demographic groups most similar to Kenyans are Yugoslavian ($42,792, a difference of 0.040%), Iraqi ($42,760, a difference of 0.11%), Immigrants from Sierra Leone ($42,752, a difference of 0.13%), Bermudan ($42,911, a difference of 0.24%), and Immigrants from Fiji ($42,694, a difference of 0.27%).
| Demographics | Rating | Rank | Per Capita Income |
| Germans | 33.9 /100 | #183 | Fair $43,067 |
| Spaniards | 32.9 /100 | #184 | Fair $43,028 |
| Immigrants | Immigrants | 32.5 /100 | #185 | Fair $43,010 |
| French Canadians | 32.3 /100 | #186 | Fair $43,003 |
| Immigrants | Colombia | 31.5 /100 | #187 | Fair $42,971 |
| Immigrants | Africa | 31.0 /100 | #188 | Fair $42,950 |
| Bermudans | 30.1 /100 | #189 | Fair $42,911 |
| Kenyans | 27.7 /100 | #190 | Fair $42,808 |
| Yugoslavians | 27.4 /100 | #191 | Fair $42,792 |
| Iraqis | 26.7 /100 | #192 | Fair $42,760 |
| Immigrants | Sierra Leone | 26.5 /100 | #193 | Fair $42,752 |
| Immigrants | Fiji | 25.2 /100 | #194 | Fair $42,694 |
| Immigrants | Kenya | 24.5 /100 | #195 | Fair $42,661 |
| Dutch | 23.4 /100 | #196 | Fair $42,605 |
| Scotch-Irish | 22.6 /100 | #197 | Fair $42,563 |