South African vs New Zealander Median Household Income
COMPARE
South African
New Zealander
Median Household Income
Median Household Income Comparison
South Africans
New Zealanders
$93,379
MEDIAN HOUSEHOLD INCOME
99.5/ 100
METRIC RATING
76th/ 347
METRIC RANK
$95,146
MEDIAN HOUSEHOLD INCOME
99.8/ 100
METRIC RATING
57th/ 347
METRIC RANK
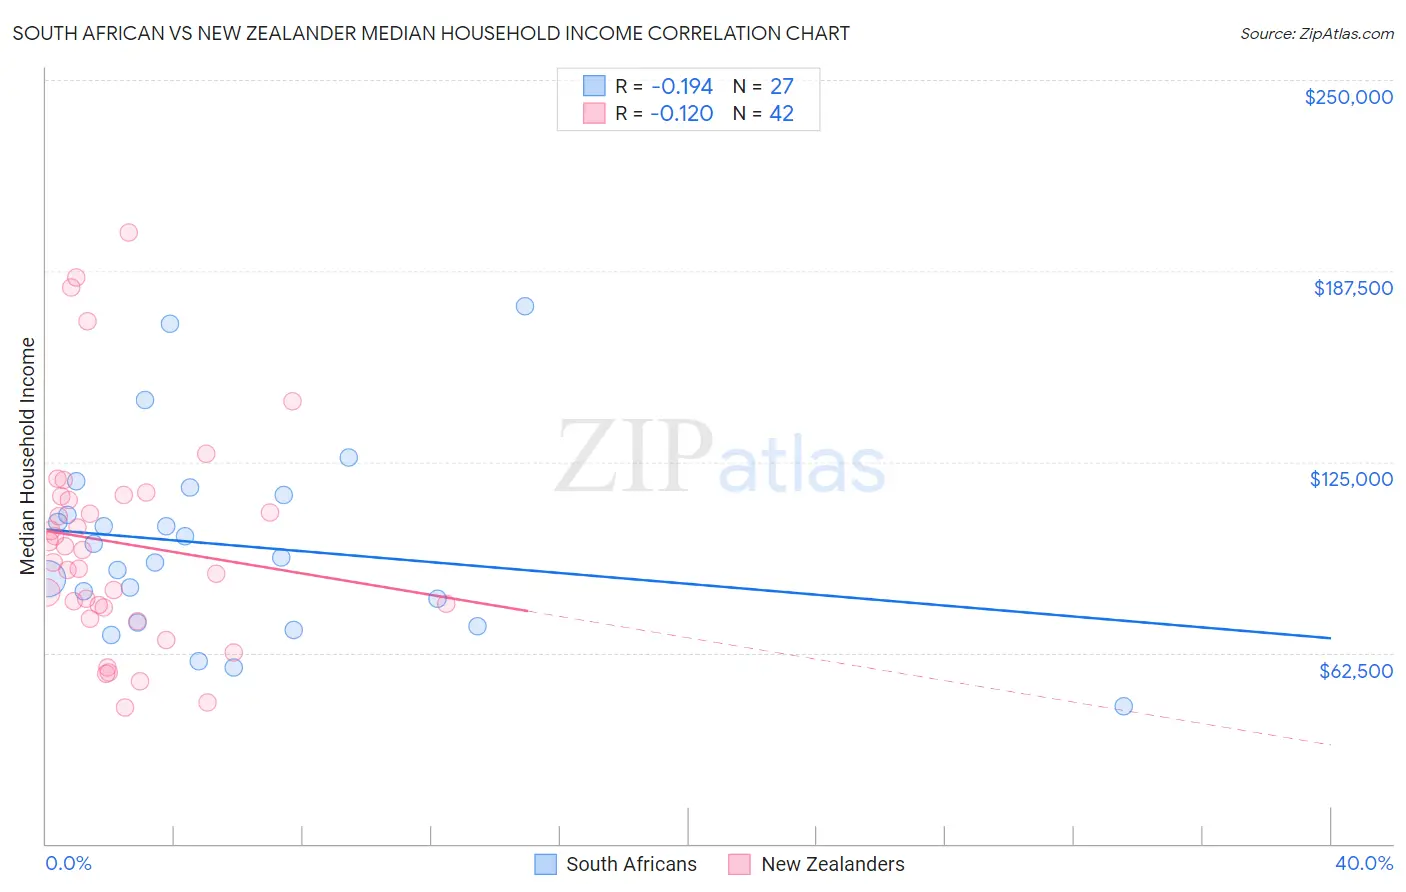
South African vs New Zealander Median Household Income Correlation Chart
The statistical analysis conducted on geographies consisting of 182,537,527 people shows a poor negative correlation between the proportion of South Africans and median household income in the United States with a correlation coefficient (R) of -0.194 and weighted average of $93,379. Similarly, the statistical analysis conducted on geographies consisting of 106,891,661 people shows a poor negative correlation between the proportion of New Zealanders and median household income in the United States with a correlation coefficient (R) of -0.120 and weighted average of $95,146, a difference of 1.9%.
Median Household Income Correlation Summary
| Measurement | South African | New Zealander |
| Minimum | $45,000 | $44,447 |
| Maximum | $176,103 | $200,054 |
| Range | $131,103 | $155,607 |
| Mean | $97,725 | $98,486 |
| Median | $93,672 | $94,049 |
| Interquartile 25% (IQ1) | $72,324 | $77,381 |
| Interquartile 75% (IQ3) | $113,958 | $113,735 |
| Interquartile Range (IQR) | $41,634 | $36,354 |
| Standard Deviation (Sample) | $31,372 | $36,469 |
| Standard Deviation (Population) | $30,786 | $36,032 |
Demographics Similar to South Africans and New Zealanders by Median Household Income
In terms of median household income, the demographic groups most similar to South Africans are Immigrants from Italy ($93,465, a difference of 0.090%), Immigrants from Latvia ($93,602, a difference of 0.24%), Immigrants from Egypt ($93,700, a difference of 0.34%), Lithuanian ($93,852, a difference of 0.51%), and Immigrants from Philippines ($93,899, a difference of 0.56%). Similarly, the demographic groups most similar to New Zealanders are Soviet Union ($95,098, a difference of 0.050%), Immigrants from Europe ($95,032, a difference of 0.12%), Korean ($95,018, a difference of 0.13%), Immigrants from Austria ($95,277, a difference of 0.14%), and Laotian ($94,990, a difference of 0.16%).
| Demographics | Rating | Rank | Median Household Income |
| Immigrants | Austria | 99.9 /100 | #56 | Exceptional $95,277 |
| New Zealanders | 99.8 /100 | #57 | Exceptional $95,146 |
| Soviet Union | 99.8 /100 | #58 | Exceptional $95,098 |
| Immigrants | Europe | 99.8 /100 | #59 | Exceptional $95,032 |
| Koreans | 99.8 /100 | #60 | Exceptional $95,018 |
| Laotians | 99.8 /100 | #61 | Exceptional $94,990 |
| Immigrants | Norway | 99.8 /100 | #62 | Exceptional $94,846 |
| Greeks | 99.8 /100 | #63 | Exceptional $94,735 |
| Immigrants | Netherlands | 99.7 /100 | #64 | Exceptional $94,411 |
| Immigrants | Belarus | 99.7 /100 | #65 | Exceptional $94,399 |
| Immigrants | Romania | 99.7 /100 | #66 | Exceptional $94,222 |
| Immigrants | Scotland | 99.7 /100 | #67 | Exceptional $94,091 |
| Mongolians | 99.7 /100 | #68 | Exceptional $93,971 |
| Argentineans | 99.7 /100 | #69 | Exceptional $93,960 |
| Immigrants | Fiji | 99.7 /100 | #70 | Exceptional $93,933 |
| Immigrants | Philippines | 99.6 /100 | #71 | Exceptional $93,899 |
| Lithuanians | 99.6 /100 | #72 | Exceptional $93,852 |
| Immigrants | Egypt | 99.6 /100 | #73 | Exceptional $93,700 |
| Immigrants | Latvia | 99.6 /100 | #74 | Exceptional $93,602 |
| Immigrants | Italy | 99.5 /100 | #75 | Exceptional $93,465 |
| South Africans | 99.5 /100 | #76 | Exceptional $93,379 |