South African vs Immigrants from Singapore Householder Income Under 25 years
COMPARE
South African
Immigrants from Singapore
Householder Income Under 25 years
Householder Income Under 25 years Comparison
South Africans
Immigrants from Singapore
$51,383
HOUSEHOLDER INCOME UNDER 25 YEARS
12.2/ 100
METRIC RATING
207th/ 347
METRIC RANK
$56,835
HOUSEHOLDER INCOME UNDER 25 YEARS
100.0/ 100
METRIC RATING
24th/ 347
METRIC RANK
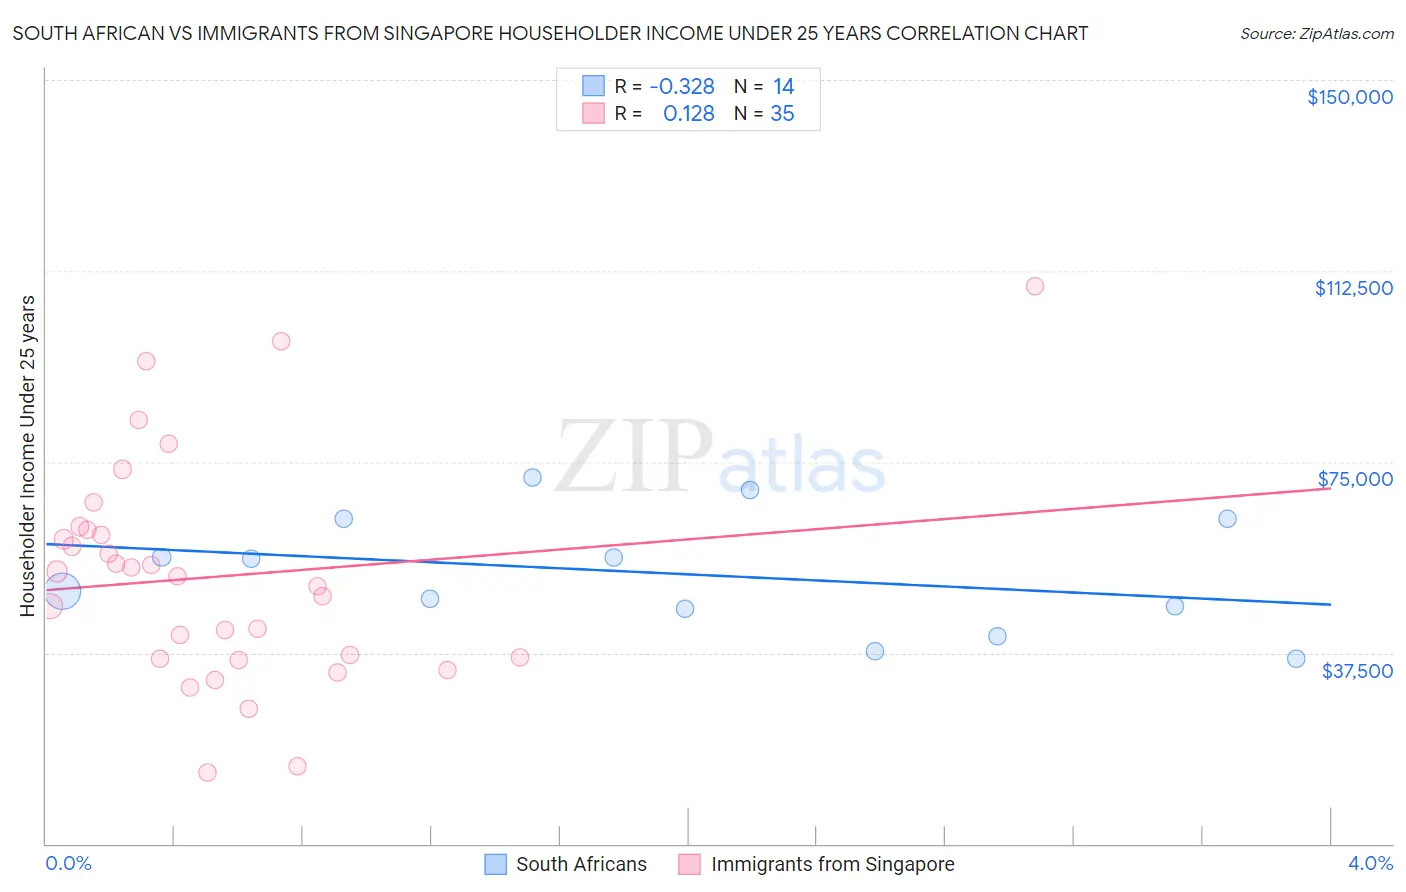
South African vs Immigrants from Singapore Householder Income Under 25 years Correlation Chart
The statistical analysis conducted on geographies consisting of 162,551,687 people shows a mild negative correlation between the proportion of South Africans and household income with householder under the age of 25 in the United States with a correlation coefficient (R) of -0.328 and weighted average of $51,383. Similarly, the statistical analysis conducted on geographies consisting of 123,473,430 people shows a poor positive correlation between the proportion of Immigrants from Singapore and household income with householder under the age of 25 in the United States with a correlation coefficient (R) of 0.128 and weighted average of $56,835, a difference of 10.6%.
Householder Income Under 25 years Correlation Summary
| Measurement | South African | Immigrants from Singapore |
| Minimum | $36,406 | $14,087 |
| Maximum | $72,020 | $109,471 |
| Range | $35,614 | $95,384 |
| Mean | $53,067 | $52,518 |
| Median | $52,781 | $52,500 |
| Interquartile 25% (IQ1) | $46,113 | $36,250 |
| Interquartile 75% (IQ3) | $63,791 | $61,737 |
| Interquartile Range (IQR) | $17,678 | $25,487 |
| Standard Deviation (Sample) | $11,360 | $21,943 |
| Standard Deviation (Population) | $10,947 | $21,627 |
Similar Demographics by Householder Income Under 25 years
Demographics Similar to South Africans by Householder Income Under 25 years
In terms of householder income under 25 years, the demographic groups most similar to South Africans are Cape Verdean ($51,387, a difference of 0.010%), Immigrants from Latin America ($51,387, a difference of 0.010%), Immigrants from Jordan ($51,370, a difference of 0.020%), Syrian ($51,353, a difference of 0.060%), and Czech ($51,421, a difference of 0.070%).
| Demographics | Rating | Rank | Householder Income Under 25 years |
| Immigrants | West Indies | 14.9 /100 | #200 | Poor $51,479 |
| British | 14.9 /100 | #201 | Poor $51,477 |
| Immigrants | Guatemala | 14.0 /100 | #202 | Poor $51,447 |
| Immigrants | Cameroon | 13.6 /100 | #203 | Poor $51,433 |
| Czechs | 13.2 /100 | #204 | Poor $51,421 |
| Cape Verdeans | 12.3 /100 | #205 | Poor $51,387 |
| Immigrants | Latin America | 12.3 /100 | #206 | Poor $51,387 |
| South Africans | 12.2 /100 | #207 | Poor $51,383 |
| Immigrants | Jordan | 11.9 /100 | #208 | Poor $51,370 |
| Syrians | 11.4 /100 | #209 | Poor $51,353 |
| Immigrants | Ghana | 10.9 /100 | #210 | Poor $51,333 |
| Irish | 10.6 /100 | #211 | Poor $51,317 |
| Immigrants | Panama | 9.7 /100 | #212 | Tragic $51,278 |
| Dutch | 9.4 /100 | #213 | Tragic $51,265 |
| Zimbabweans | 9.3 /100 | #214 | Tragic $51,259 |
Demographics Similar to Immigrants from Singapore by Householder Income Under 25 years
In terms of householder income under 25 years, the demographic groups most similar to Immigrants from Singapore are Immigrants from Pakistan ($56,789, a difference of 0.080%), Tongan ($56,972, a difference of 0.24%), Asian ($57,003, a difference of 0.29%), Immigrants from Australia ($56,660, a difference of 0.31%), and Immigrants from Ireland ($57,075, a difference of 0.42%).
| Demographics | Rating | Rank | Householder Income Under 25 years |
| Sierra Leoneans | 100.0 /100 | #17 | Exceptional $57,272 |
| Immigrants | Eastern Asia | 100.0 /100 | #18 | Exceptional $57,123 |
| Bhutanese | 100.0 /100 | #19 | Exceptional $57,078 |
| Immigrants | Ireland | 100.0 /100 | #20 | Exceptional $57,075 |
| Immigrants | Fiji | 100.0 /100 | #21 | Exceptional $57,074 |
| Asians | 100.0 /100 | #22 | Exceptional $57,003 |
| Tongans | 100.0 /100 | #23 | Exceptional $56,972 |
| Immigrants | Singapore | 100.0 /100 | #24 | Exceptional $56,835 |
| Immigrants | Pakistan | 100.0 /100 | #25 | Exceptional $56,789 |
| Immigrants | Australia | 100.0 /100 | #26 | Exceptional $56,660 |
| Immigrants | North Macedonia | 100.0 /100 | #27 | Exceptional $56,503 |
| Immigrants | Peru | 100.0 /100 | #28 | Exceptional $56,384 |
| Immigrants | Asia | 100.0 /100 | #29 | Exceptional $56,379 |
| Immigrants | Moldova | 100.0 /100 | #30 | Exceptional $56,168 |
| Vietnamese | 100.0 /100 | #31 | Exceptional $56,127 |