Senegalese vs Immigrants from Taiwan Median Male Earnings
COMPARE
Senegalese
Immigrants from Taiwan
Median Male Earnings
Median Male Earnings Comparison
Senegalese
Immigrants from Taiwan
$49,774
MEDIAN MALE EARNINGS
1.0/ 100
METRIC RATING
254th/ 347
METRIC RANK
$74,031
MEDIAN MALE EARNINGS
100.0/ 100
METRIC RATING
3rd/ 347
METRIC RANK
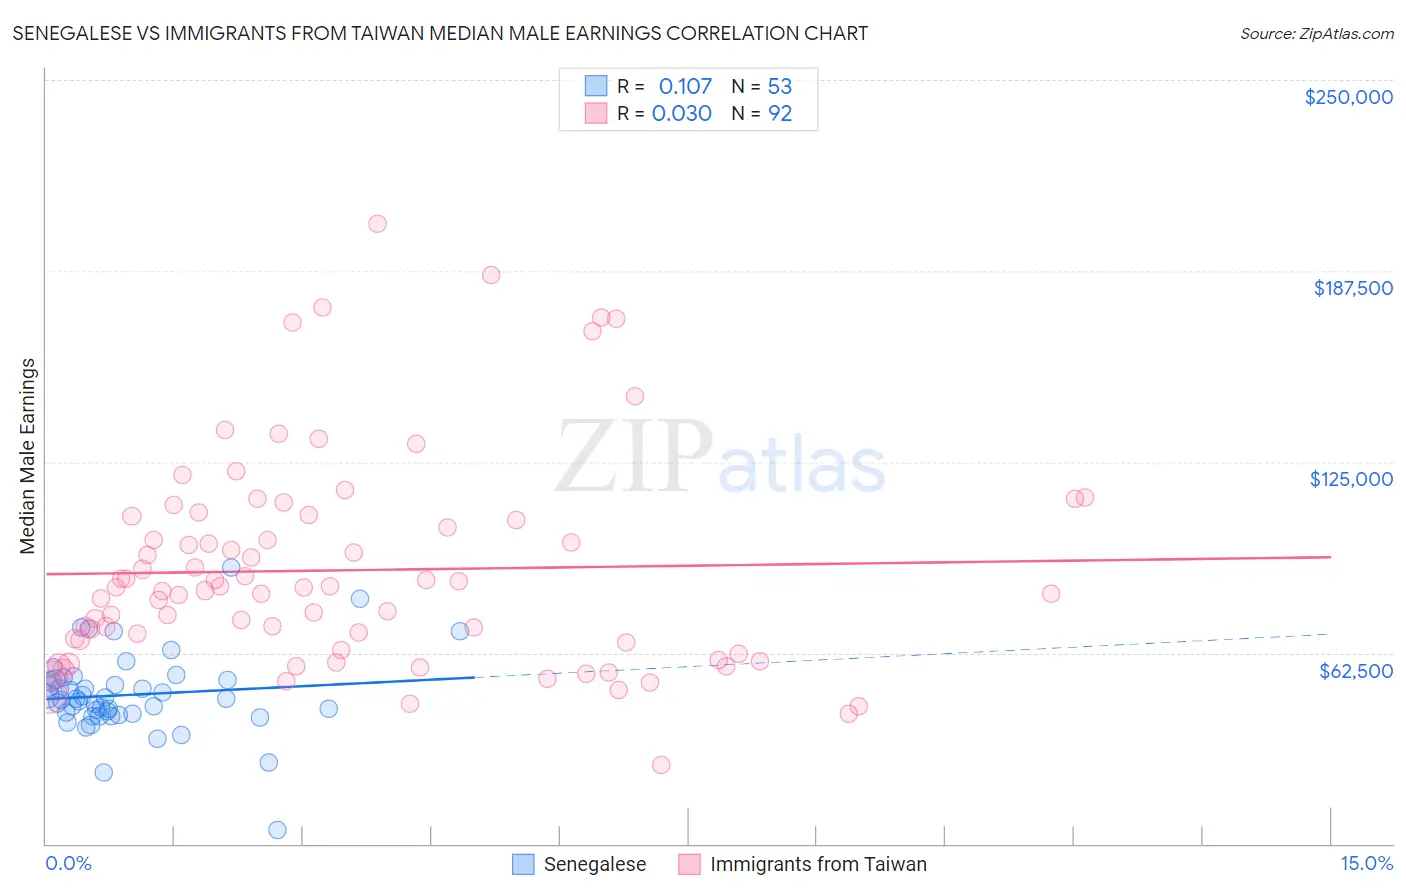
Senegalese vs Immigrants from Taiwan Median Male Earnings Correlation Chart
The statistical analysis conducted on geographies consisting of 78,104,359 people shows a poor positive correlation between the proportion of Senegalese and median male earnings in the United States with a correlation coefficient (R) of 0.107 and weighted average of $49,774. Similarly, the statistical analysis conducted on geographies consisting of 298,261,380 people shows no correlation between the proportion of Immigrants from Taiwan and median male earnings in the United States with a correlation coefficient (R) of 0.030 and weighted average of $74,031, a difference of 48.7%.
Median Male Earnings Correlation Summary
| Measurement | Senegalese | Immigrants from Taiwan |
| Minimum | $4,513 | $25,921 |
| Maximum | $90,259 | $202,837 |
| Range | $85,746 | $176,916 |
| Mean | $48,737 | $89,558 |
| Median | $47,653 | $83,311 |
| Interquartile 25% (IQ1) | $42,459 | $64,686 |
| Interquartile 75% (IQ3) | $53,697 | $106,599 |
| Interquartile Range (IQR) | $11,239 | $41,914 |
| Standard Deviation (Sample) | $13,453 | $34,934 |
| Standard Deviation (Population) | $13,326 | $34,744 |
Similar Demographics by Median Male Earnings
Demographics Similar to Senegalese by Median Male Earnings
In terms of median male earnings, the demographic groups most similar to Senegalese are Alaskan Athabascan ($49,748, a difference of 0.050%), Alaska Native ($49,711, a difference of 0.13%), British West Indian ($49,636, a difference of 0.28%), German Russian ($49,924, a difference of 0.30%), and Immigrants from Cabo Verde ($50,009, a difference of 0.47%).
| Demographics | Rating | Rank | Median Male Earnings |
| Sub-Saharan Africans | 1.8 /100 | #247 | Tragic $50,408 |
| Immigrants | Guyana | 1.6 /100 | #248 | Tragic $50,321 |
| Immigrants | Burma/Myanmar | 1.6 /100 | #249 | Tragic $50,298 |
| Osage | 1.6 /100 | #250 | Tragic $50,292 |
| Immigrants | Grenada | 1.6 /100 | #251 | Tragic $50,279 |
| Immigrants | Cabo Verde | 1.2 /100 | #252 | Tragic $50,009 |
| German Russians | 1.1 /100 | #253 | Tragic $49,924 |
| Senegalese | 1.0 /100 | #254 | Tragic $49,774 |
| Alaskan Athabascans | 0.9 /100 | #255 | Tragic $49,748 |
| Alaska Natives | 0.9 /100 | #256 | Tragic $49,711 |
| British West Indians | 0.8 /100 | #257 | Tragic $49,636 |
| Cree | 0.7 /100 | #258 | Tragic $49,497 |
| Nepalese | 0.7 /100 | #259 | Tragic $49,458 |
| Iroquois | 0.7 /100 | #260 | Tragic $49,374 |
| Liberians | 0.6 /100 | #261 | Tragic $49,318 |
Demographics Similar to Immigrants from Taiwan by Median Male Earnings
In terms of median male earnings, the demographic groups most similar to Immigrants from Taiwan are Immigrants from India ($74,207, a difference of 0.24%), Filipino ($74,224, a difference of 0.26%), Thai ($72,135, a difference of 2.6%), Immigrants from Singapore ($71,348, a difference of 3.8%), and Iranian ($70,648, a difference of 4.8%).
| Demographics | Rating | Rank | Median Male Earnings |
| Filipinos | 100.0 /100 | #1 | Exceptional $74,224 |
| Immigrants | India | 100.0 /100 | #2 | Exceptional $74,207 |
| Immigrants | Taiwan | 100.0 /100 | #3 | Exceptional $74,031 |
| Thais | 100.0 /100 | #4 | Exceptional $72,135 |
| Immigrants | Singapore | 100.0 /100 | #5 | Exceptional $71,348 |
| Iranians | 100.0 /100 | #6 | Exceptional $70,648 |
| Immigrants | Hong Kong | 100.0 /100 | #7 | Exceptional $70,146 |
| Immigrants | Iran | 100.0 /100 | #8 | Exceptional $69,284 |
| Immigrants | South Central Asia | 100.0 /100 | #9 | Exceptional $68,960 |
| Immigrants | Israel | 100.0 /100 | #10 | Exceptional $68,716 |
| Immigrants | Ireland | 100.0 /100 | #11 | Exceptional $67,698 |
| Immigrants | Australia | 100.0 /100 | #12 | Exceptional $67,634 |
| Immigrants | China | 100.0 /100 | #13 | Exceptional $67,353 |
| Okinawans | 100.0 /100 | #14 | Exceptional $67,232 |
| Immigrants | Eastern Asia | 100.0 /100 | #15 | Exceptional $66,903 |