Senegalese vs Immigrants from Malaysia Median Male Earnings
COMPARE
Senegalese
Immigrants from Malaysia
Median Male Earnings
Median Male Earnings Comparison
Senegalese
Immigrants from Malaysia
$49,774
MEDIAN MALE EARNINGS
1.0/ 100
METRIC RATING
254th/ 347
METRIC RANK
$62,121
MEDIAN MALE EARNINGS
99.9/ 100
METRIC RATING
48th/ 347
METRIC RANK
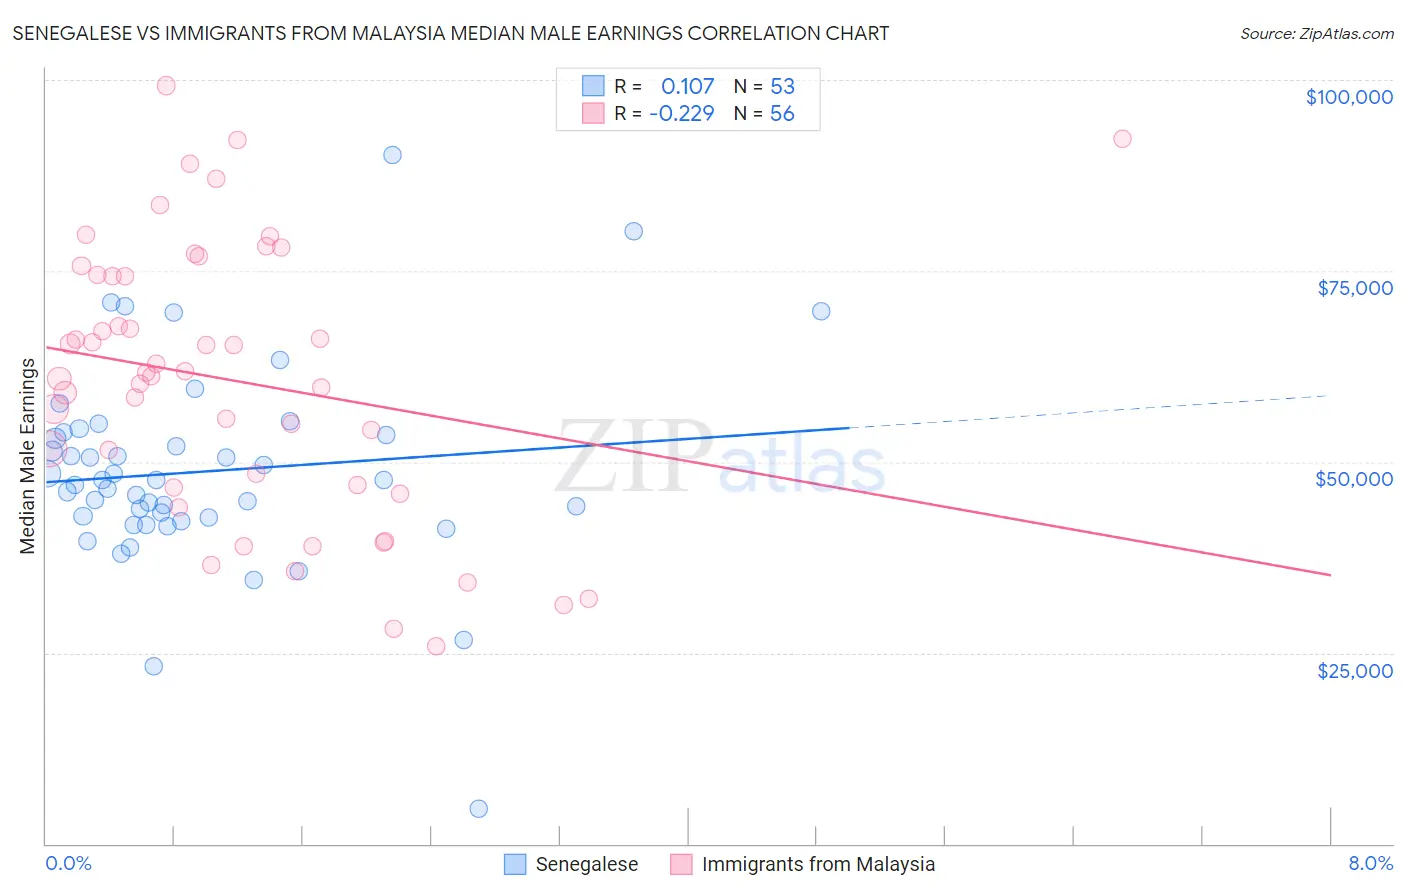
Senegalese vs Immigrants from Malaysia Median Male Earnings Correlation Chart
The statistical analysis conducted on geographies consisting of 78,104,359 people shows a poor positive correlation between the proportion of Senegalese and median male earnings in the United States with a correlation coefficient (R) of 0.107 and weighted average of $49,774. Similarly, the statistical analysis conducted on geographies consisting of 197,949,905 people shows a weak negative correlation between the proportion of Immigrants from Malaysia and median male earnings in the United States with a correlation coefficient (R) of -0.229 and weighted average of $62,121, a difference of 24.8%.
Median Male Earnings Correlation Summary
| Measurement | Senegalese | Immigrants from Malaysia |
| Minimum | $4,513 | $25,921 |
| Maximum | $90,259 | $99,264 |
| Range | $85,746 | $73,343 |
| Mean | $48,737 | $60,570 |
| Median | $47,653 | $61,469 |
| Interquartile 25% (IQ1) | $42,459 | $46,765 |
| Interquartile 75% (IQ3) | $53,697 | $74,461 |
| Interquartile Range (IQR) | $11,239 | $27,696 |
| Standard Deviation (Sample) | $13,453 | $17,826 |
| Standard Deviation (Population) | $13,326 | $17,666 |
Similar Demographics by Median Male Earnings
Demographics Similar to Senegalese by Median Male Earnings
In terms of median male earnings, the demographic groups most similar to Senegalese are Alaskan Athabascan ($49,748, a difference of 0.050%), Alaska Native ($49,711, a difference of 0.13%), British West Indian ($49,636, a difference of 0.28%), German Russian ($49,924, a difference of 0.30%), and Immigrants from Cabo Verde ($50,009, a difference of 0.47%).
| Demographics | Rating | Rank | Median Male Earnings |
| Sub-Saharan Africans | 1.8 /100 | #247 | Tragic $50,408 |
| Immigrants | Guyana | 1.6 /100 | #248 | Tragic $50,321 |
| Immigrants | Burma/Myanmar | 1.6 /100 | #249 | Tragic $50,298 |
| Osage | 1.6 /100 | #250 | Tragic $50,292 |
| Immigrants | Grenada | 1.6 /100 | #251 | Tragic $50,279 |
| Immigrants | Cabo Verde | 1.2 /100 | #252 | Tragic $50,009 |
| German Russians | 1.1 /100 | #253 | Tragic $49,924 |
| Senegalese | 1.0 /100 | #254 | Tragic $49,774 |
| Alaskan Athabascans | 0.9 /100 | #255 | Tragic $49,748 |
| Alaska Natives | 0.9 /100 | #256 | Tragic $49,711 |
| British West Indians | 0.8 /100 | #257 | Tragic $49,636 |
| Cree | 0.7 /100 | #258 | Tragic $49,497 |
| Nepalese | 0.7 /100 | #259 | Tragic $49,458 |
| Iroquois | 0.7 /100 | #260 | Tragic $49,374 |
| Liberians | 0.6 /100 | #261 | Tragic $49,318 |
Demographics Similar to Immigrants from Malaysia by Median Male Earnings
In terms of median male earnings, the demographic groups most similar to Immigrants from Malaysia are Immigrants from Austria ($62,164, a difference of 0.070%), Immigrants from Europe ($62,057, a difference of 0.10%), Immigrants from Czechoslovakia ($62,217, a difference of 0.15%), Bulgarian ($62,378, a difference of 0.41%), and Bhutanese ($61,759, a difference of 0.59%).
| Demographics | Rating | Rank | Median Male Earnings |
| Immigrants | Turkey | 100.0 /100 | #41 | Exceptional $62,728 |
| Immigrants | Greece | 100.0 /100 | #42 | Exceptional $62,689 |
| Immigrants | Belarus | 100.0 /100 | #43 | Exceptional $62,658 |
| Cambodians | 100.0 /100 | #44 | Exceptional $62,516 |
| Bulgarians | 100.0 /100 | #45 | Exceptional $62,378 |
| Immigrants | Czechoslovakia | 99.9 /100 | #46 | Exceptional $62,217 |
| Immigrants | Austria | 99.9 /100 | #47 | Exceptional $62,164 |
| Immigrants | Malaysia | 99.9 /100 | #48 | Exceptional $62,121 |
| Immigrants | Europe | 99.9 /100 | #49 | Exceptional $62,057 |
| Bhutanese | 99.9 /100 | #50 | Exceptional $61,759 |
| Estonians | 99.9 /100 | #51 | Exceptional $61,710 |
| Immigrants | Norway | 99.9 /100 | #52 | Exceptional $61,628 |
| South Africans | 99.9 /100 | #53 | Exceptional $61,460 |
| Immigrants | Latvia | 99.9 /100 | #54 | Exceptional $61,422 |
| Greeks | 99.9 /100 | #55 | Exceptional $61,242 |