Seminole vs Ukrainian Per Capita Income
COMPARE
Seminole
Ukrainian
Per Capita Income
Per Capita Income Comparison
Seminole
Ukrainians
$36,180
PER CAPITA INCOME
0.0/ 100
METRIC RATING
314th/ 347
METRIC RANK
$48,014
PER CAPITA INCOME
99.3/ 100
METRIC RATING
87th/ 347
METRIC RANK
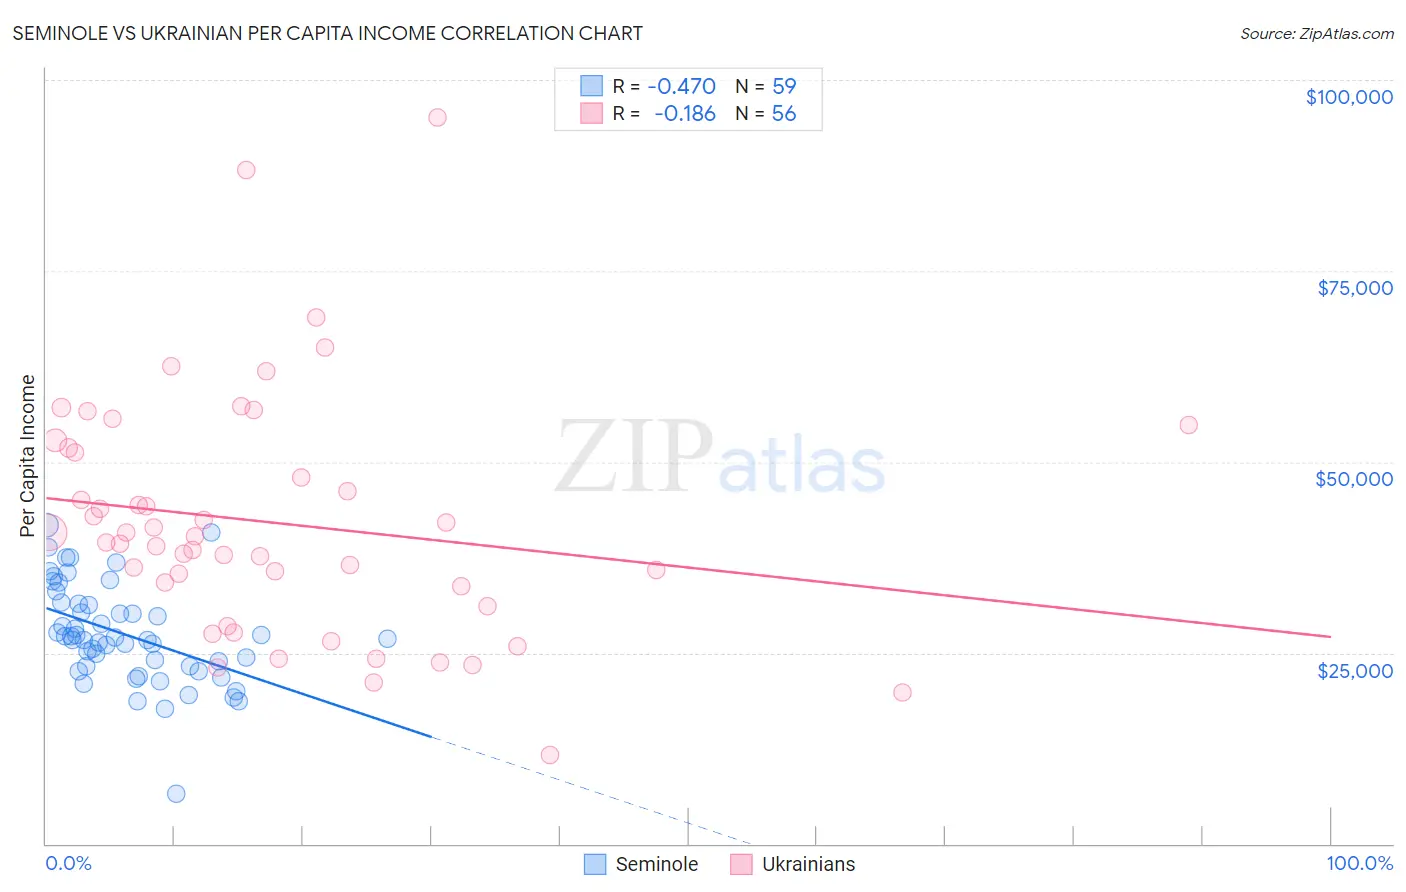
Seminole vs Ukrainian Per Capita Income Correlation Chart
The statistical analysis conducted on geographies consisting of 118,313,864 people shows a moderate negative correlation between the proportion of Seminole and per capita income in the United States with a correlation coefficient (R) of -0.470 and weighted average of $36,180. Similarly, the statistical analysis conducted on geographies consisting of 448,721,179 people shows a poor negative correlation between the proportion of Ukrainians and per capita income in the United States with a correlation coefficient (R) of -0.186 and weighted average of $48,014, a difference of 32.7%.
Per Capita Income Correlation Summary
| Measurement | Seminole | Ukrainian |
| Minimum | $6,596 | $11,586 |
| Maximum | $41,755 | $95,117 |
| Range | $35,159 | $83,531 |
| Mean | $27,427 | $42,023 |
| Median | $26,891 | $39,896 |
| Interquartile 25% (IQ1) | $23,175 | $32,403 |
| Interquartile 75% (IQ3) | $31,374 | $51,527 |
| Interquartile Range (IQR) | $8,199 | $19,124 |
| Standard Deviation (Sample) | $6,480 | $15,846 |
| Standard Deviation (Population) | $6,425 | $15,703 |
Similar Demographics by Per Capita Income
Demographics Similar to Seminole by Per Capita Income
In terms of per capita income, the demographic groups most similar to Seminole are Yaqui ($36,112, a difference of 0.19%), Choctaw ($35,999, a difference of 0.50%), Bahamian ($36,427, a difference of 0.68%), Dutch West Indian ($35,922, a difference of 0.72%), and Bangladeshi ($35,897, a difference of 0.79%).
| Demographics | Rating | Rank | Per Capita Income |
| Immigrants | Latin America | 0.0 /100 | #307 | Tragic $36,823 |
| Fijians | 0.0 /100 | #308 | Tragic $36,690 |
| Immigrants | Honduras | 0.0 /100 | #309 | Tragic $36,665 |
| Ute | 0.0 /100 | #310 | Tragic $36,651 |
| Chippewa | 0.0 /100 | #311 | Tragic $36,631 |
| Chickasaw | 0.0 /100 | #312 | Tragic $36,475 |
| Bahamians | 0.0 /100 | #313 | Tragic $36,427 |
| Seminole | 0.0 /100 | #314 | Tragic $36,180 |
| Yaqui | 0.0 /100 | #315 | Tragic $36,112 |
| Choctaw | 0.0 /100 | #316 | Tragic $35,999 |
| Dutch West Indians | 0.0 /100 | #317 | Tragic $35,922 |
| Bangladeshis | 0.0 /100 | #318 | Tragic $35,897 |
| Immigrants | Congo | 0.0 /100 | #319 | Tragic $35,720 |
| Hispanics or Latinos | 0.0 /100 | #320 | Tragic $35,688 |
| Blacks/African Americans | 0.0 /100 | #321 | Tragic $35,564 |
Demographics Similar to Ukrainians by Per Capita Income
In terms of per capita income, the demographic groups most similar to Ukrainians are Immigrants from Southern Europe ($48,027, a difference of 0.030%), Austrian ($48,116, a difference of 0.21%), Immigrants from Ukraine ($48,134, a difference of 0.25%), Immigrants from Brazil ($48,164, a difference of 0.31%), and Immigrants from Indonesia ($48,195, a difference of 0.38%).
| Demographics | Rating | Rank | Per Capita Income |
| Egyptians | 99.5 /100 | #80 | Exceptional $48,358 |
| Armenians | 99.4 /100 | #81 | Exceptional $48,287 |
| Immigrants | Indonesia | 99.4 /100 | #82 | Exceptional $48,195 |
| Immigrants | Brazil | 99.4 /100 | #83 | Exceptional $48,164 |
| Immigrants | Ukraine | 99.3 /100 | #84 | Exceptional $48,134 |
| Austrians | 99.3 /100 | #85 | Exceptional $48,116 |
| Immigrants | Southern Europe | 99.3 /100 | #86 | Exceptional $48,027 |
| Ukrainians | 99.3 /100 | #87 | Exceptional $48,014 |
| Croatians | 99.0 /100 | #88 | Exceptional $47,742 |
| Northern Europeans | 98.9 /100 | #89 | Exceptional $47,698 |
| Italians | 98.8 /100 | #90 | Exceptional $47,574 |
| Macedonians | 98.8 /100 | #91 | Exceptional $47,573 |
| Immigrants | Moldova | 98.7 /100 | #92 | Exceptional $47,489 |
| Immigrants | Zimbabwe | 98.5 /100 | #93 | Exceptional $47,394 |
| Albanians | 98.5 /100 | #94 | Exceptional $47,379 |