Seminole vs Immigrants from Nicaragua Per Capita Income
COMPARE
Seminole
Immigrants from Nicaragua
Per Capita Income
Per Capita Income Comparison
Seminole
Immigrants from Nicaragua
$36,180
PER CAPITA INCOME
0.0/ 100
METRIC RATING
314th/ 347
METRIC RANK
$38,065
PER CAPITA INCOME
0.2/ 100
METRIC RATING
278th/ 347
METRIC RANK
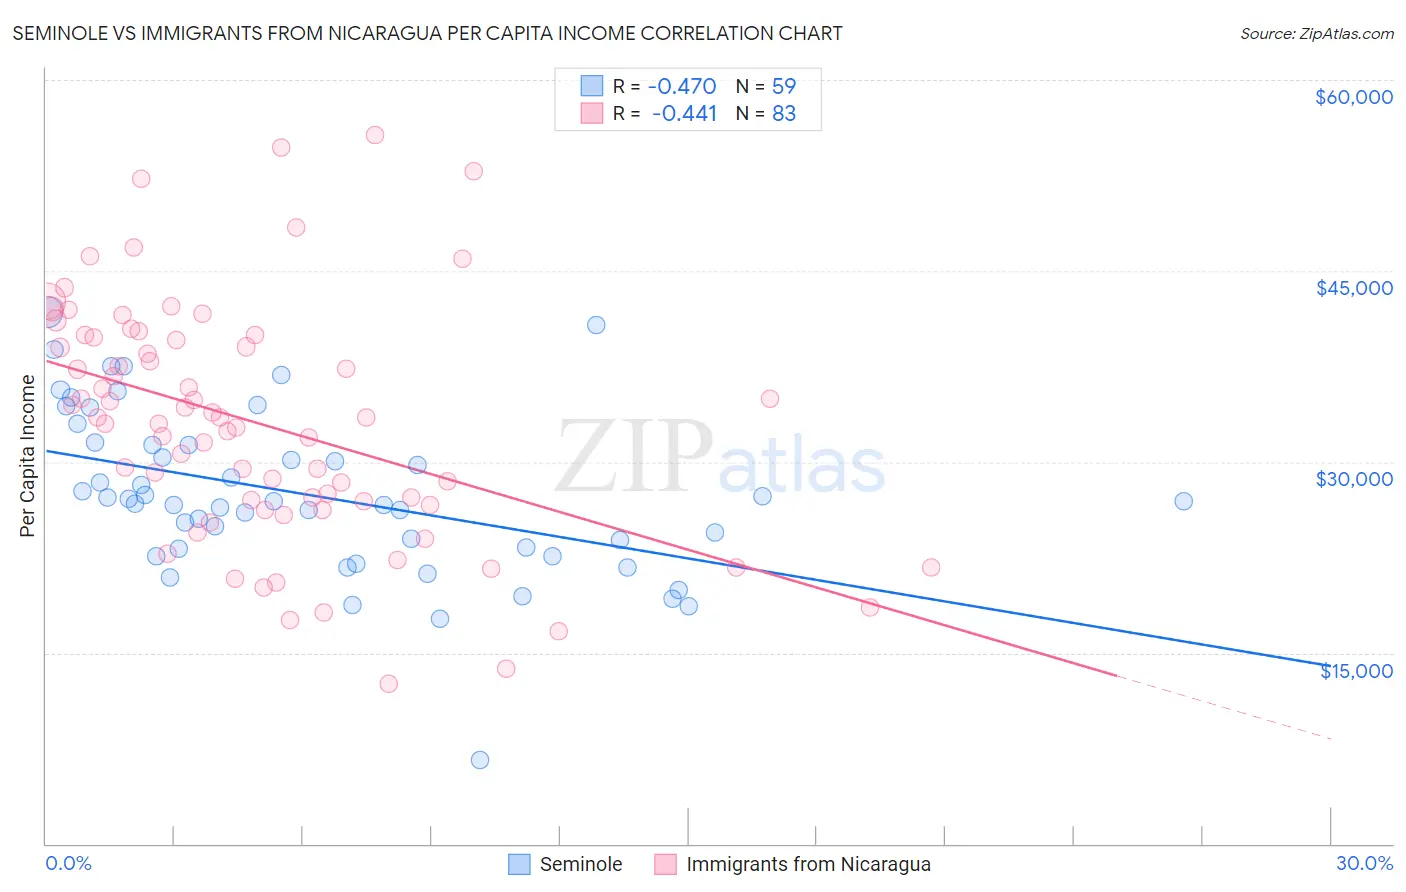
Seminole vs Immigrants from Nicaragua Per Capita Income Correlation Chart
The statistical analysis conducted on geographies consisting of 118,313,864 people shows a moderate negative correlation between the proportion of Seminole and per capita income in the United States with a correlation coefficient (R) of -0.470 and weighted average of $36,180. Similarly, the statistical analysis conducted on geographies consisting of 236,340,517 people shows a moderate negative correlation between the proportion of Immigrants from Nicaragua and per capita income in the United States with a correlation coefficient (R) of -0.441 and weighted average of $38,065, a difference of 5.2%.
Per Capita Income Correlation Summary
| Measurement | Seminole | Immigrants from Nicaragua |
| Minimum | $6,596 | $12,549 |
| Maximum | $41,755 | $55,632 |
| Range | $35,159 | $43,083 |
| Mean | $27,427 | $33,018 |
| Median | $26,891 | $33,470 |
| Interquartile 25% (IQ1) | $23,175 | $26,578 |
| Interquartile 75% (IQ3) | $31,374 | $39,762 |
| Interquartile Range (IQR) | $8,199 | $13,184 |
| Standard Deviation (Sample) | $6,480 | $9,366 |
| Standard Deviation (Population) | $6,425 | $9,309 |
Similar Demographics by Per Capita Income
Demographics Similar to Seminole by Per Capita Income
In terms of per capita income, the demographic groups most similar to Seminole are Yaqui ($36,112, a difference of 0.19%), Choctaw ($35,999, a difference of 0.50%), Bahamian ($36,427, a difference of 0.68%), Dutch West Indian ($35,922, a difference of 0.72%), and Bangladeshi ($35,897, a difference of 0.79%).
| Demographics | Rating | Rank | Per Capita Income |
| Immigrants | Latin America | 0.0 /100 | #307 | Tragic $36,823 |
| Fijians | 0.0 /100 | #308 | Tragic $36,690 |
| Immigrants | Honduras | 0.0 /100 | #309 | Tragic $36,665 |
| Ute | 0.0 /100 | #310 | Tragic $36,651 |
| Chippewa | 0.0 /100 | #311 | Tragic $36,631 |
| Chickasaw | 0.0 /100 | #312 | Tragic $36,475 |
| Bahamians | 0.0 /100 | #313 | Tragic $36,427 |
| Seminole | 0.0 /100 | #314 | Tragic $36,180 |
| Yaqui | 0.0 /100 | #315 | Tragic $36,112 |
| Choctaw | 0.0 /100 | #316 | Tragic $35,999 |
| Dutch West Indians | 0.0 /100 | #317 | Tragic $35,922 |
| Bangladeshis | 0.0 /100 | #318 | Tragic $35,897 |
| Immigrants | Congo | 0.0 /100 | #319 | Tragic $35,720 |
| Hispanics or Latinos | 0.0 /100 | #320 | Tragic $35,688 |
| Blacks/African Americans | 0.0 /100 | #321 | Tragic $35,564 |
Demographics Similar to Immigrants from Nicaragua by Per Capita Income
In terms of per capita income, the demographic groups most similar to Immigrants from Nicaragua are Colville ($38,047, a difference of 0.050%), Potawatomi ($38,046, a difference of 0.050%), Comanche ($38,088, a difference of 0.060%), Hmong ($38,120, a difference of 0.15%), and Immigrants from Liberia ($38,165, a difference of 0.26%).
| Demographics | Rating | Rank | Per Capita Income |
| Central Americans | 0.3 /100 | #271 | Tragic $38,560 |
| Immigrants | Cabo Verde | 0.3 /100 | #272 | Tragic $38,540 |
| Nepalese | 0.3 /100 | #273 | Tragic $38,442 |
| Immigrants | El Salvador | 0.3 /100 | #274 | Tragic $38,394 |
| Immigrants | Liberia | 0.2 /100 | #275 | Tragic $38,165 |
| Hmong | 0.2 /100 | #276 | Tragic $38,120 |
| Comanche | 0.2 /100 | #277 | Tragic $38,088 |
| Immigrants | Nicaragua | 0.2 /100 | #278 | Tragic $38,065 |
| Colville | 0.2 /100 | #279 | Tragic $38,047 |
| Potawatomi | 0.2 /100 | #280 | Tragic $38,046 |
| Immigrants | Dominica | 0.2 /100 | #281 | Tragic $37,952 |
| Immigrants | Laos | 0.1 /100 | #282 | Tragic $37,857 |
| Pennsylvania Germans | 0.1 /100 | #283 | Tragic $37,842 |
| Africans | 0.1 /100 | #284 | Tragic $37,785 |
| Guatemalans | 0.1 /100 | #285 | Tragic $37,766 |