Scotch-Irish vs Ukrainian Median Household Income

COMPARE

Scotch-Irish
Race
Ancestry
AfghanAfricanAlaska NativeAlaskan AthabascanAlbanianAleutAlsatianAmericanApacheArabArapahoArgentineanArmenianAssyrian/Chaldean/SyriacAustralianAustrianBahamianBangladeshiBarbadianBasqueBelgianBelizeanBermudanBhutaneseBlackfeetBolivianBrazilianBritishBritish West IndianBulgarianBurmeseCajunCambodianCanadianCape VerdeanCarpatho RusynCelticCentral AmericanCentral American IndianCherokeeCheyenneChickasawChileanChineseChippewaChoctawColombianColvilleComancheCosta RicanCreeCreekCroatianCrowCubanCypriotCzechCzechoslovakianDanishDelawareDominicanDutchDutch West IndianEastern EuropeanEcuadorianEgyptianEnglishEstonianEthiopianEuropeanFijianFilipinoFinnishFrenchFrench American IndianFrench CanadianGermanGerman RussianGhanaianGreekGuamanian/ChamorroGuatemalanGuyaneseHaitianHmongHonduranHopiHoumaHungarianIcelanderIndian (Asian)IndonesianInupiatIranianIraqiIrishIroquoisIsraeliItalianJamaicanJapaneseJordanianKenyanKiowaKoreanLaotianLatvianLebaneseLiberianLithuanianLumbeeLuxembourgerMacedonianMalaysianMalteseMarshalleseMenomineeMexicanMexican American IndianMongolianMoroccanNative HawaiianNavajoNepaleseNew ZealanderNicaraguanNigerianNorthern EuropeanNorwegianOkinawanOsageOttawaPaiutePakistaniPalestinianPanamanianParaguayanPennsylvania GermanPeruvianPimaPolishPortuguesePotawatomiPuebloPuerto RicanPuget Sound SalishRomanianRussianSalvadoranSamoanScandinavianScotch-IrishScottishSeminoleSenegaleseSerbianShoshoneSierra LeoneanSiouxSlavicSlovakSloveneSomaliSouth AfricanSouth AmericanSouth American IndianSoviet UnionSpaniardSpanishSpanish AmericanSpanish American IndianSri LankanSubsaharan AfricanSudaneseSwedishSwissSyrianTaiwaneseThaiTlingit-HaidaTohono O'OdhamTonganTrinidadian and TobagonianTsimshianTurkishU.S. Virgin IslanderUgandanUruguayanUteVenezuelanVietnameseWelshWest IndianYakamaYaquiYugoslavianYumanYup'ikZimbabwean
Immigration
NonimmigrantsImmigrantsAfghanistanAfricaAlbaniaArgentinaArmeniaAsiaAustraliaAustriaBahamasBangladeshBarbadosBelarusBelgiumBelizeBoliviaBosnia and HerzegovinaBrazilBulgariaBurma/MyanmarCabo VerdeCambodiaCameroonCanadaCaribbeanCentral AmericaChileChinaColombiaCongoCosta RicaCroatiaCubaCzechoslovakiaDenmarkDominicaDominican RepublicEastern AfricaEastern AsiaEastern EuropeEcuadorEgyptEl SalvadorEnglandEritreaEthiopiaEuropeFijiFranceGermanyGhanaGreeceGrenadaGuatemalaGuyanaHaitiHondurasHong KongHungaryIndiaIndonesiaIranIraqIrelandIsraelItalyJamaicaJapanJordanKazakhstanKenyaKoreaKuwaitLaosLatin AmericaLatviaLebanonLiberiaLithuaniaMalaysiaMexicoMicronesiaMiddle AfricaMoldovaMoroccoNepalNetherlandsNicaraguaNigeriaNorth AmericaNorth MacedoniaNorthern AfricaNorthern EuropeNorwayOceaniaPakistanPanamaPeruPhilippinesPolandPortugalRomaniaRussiaSaudi ArabiaScotlandSenegalSerbiaSierra LeoneSingaporeSomaliaSouth AfricaSouth AmericaSouth Central AsiaSouth Eastern AsiaSouthern EuropeSpainSri LankaSt. Vincent and the GrenadinesSudanSwedenSwitzerlandSyriaTaiwanThailandTrinidad and TobagoTurkeyUgandaUkraineUruguayUzbekistanVenezuelaVietnamWest IndiesWestern AfricaWestern AsiaWestern EuropeYemenZaireZimbabweAzores
Ukrainian
Race
Ancestry
AfghanAfricanAlaska NativeAlaskan AthabascanAlbanianAleutAlsatianAmericanApacheArabArapahoArgentineanArmenianAssyrian/Chaldean/SyriacAustralianAustrianBahamianBangladeshiBarbadianBasqueBelgianBelizeanBermudanBhutaneseBlackfeetBolivianBrazilianBritishBritish West IndianBulgarianBurmeseCajunCambodianCanadianCape VerdeanCarpatho RusynCelticCentral AmericanCentral American IndianCherokeeCheyenneChickasawChileanChineseChippewaChoctawColombianColvilleComancheCosta RicanCreeCreekCroatianCrowCubanCypriotCzechCzechoslovakianDanishDelawareDominicanDutchDutch West IndianEastern EuropeanEcuadorianEgyptianEnglishEstonianEthiopianEuropeanFijianFilipinoFinnishFrenchFrench American IndianFrench CanadianGermanGerman RussianGhanaianGreekGuamanian/ChamorroGuatemalanGuyaneseHaitianHmongHonduranHopiHoumaHungarianIcelanderIndian (Asian)IndonesianInupiatIranianIraqiIrishIroquoisIsraeliItalianJamaicanJapaneseJordanianKenyanKiowaKoreanLaotianLatvianLebaneseLiberianLithuanianLumbeeLuxembourgerMacedonianMalaysianMalteseMarshalleseMenomineeMexicanMexican American IndianMongolianMoroccanNative HawaiianNavajoNepaleseNew ZealanderNicaraguanNigerianNorthern EuropeanNorwegianOkinawanOsageOttawaPaiutePakistaniPalestinianPanamanianParaguayanPennsylvania GermanPeruvianPimaPolishPortuguesePotawatomiPuebloPuerto RicanPuget Sound SalishRomanianRussianSalvadoranSamoanScandinavianScottishSeminoleSenegaleseSerbianShoshoneSierra LeoneanSiouxSlavicSlovakSloveneSomaliSouth AfricanSouth AmericanSouth American IndianSoviet UnionSpaniardSpanishSpanish AmericanSpanish American IndianSri LankanSubsaharan AfricanSudaneseSwedishSwissSyrianTaiwaneseThaiTlingit-HaidaTohono O'OdhamTonganTrinidadian and TobagonianTsimshianTurkishU.S. Virgin IslanderUgandanUkrainianUruguayanUteVenezuelanVietnameseWelshWest IndianYakamaYaquiYugoslavianYumanYup'ikZimbabwean
Immigration
NonimmigrantsImmigrantsAfghanistanAfricaAlbaniaArgentinaArmeniaAsiaAustraliaAustriaBahamasBangladeshBarbadosBelarusBelgiumBelizeBoliviaBosnia and HerzegovinaBrazilBulgariaBurma/MyanmarCabo VerdeCambodiaCameroonCanadaCaribbeanCentral AmericaChileChinaColombiaCongoCosta RicaCroatiaCubaCzechoslovakiaDenmarkDominicaDominican RepublicEastern AfricaEastern AsiaEastern EuropeEcuadorEgyptEl SalvadorEnglandEritreaEthiopiaEuropeFijiFranceGermanyGhanaGreeceGrenadaGuatemalaGuyanaHaitiHondurasHong KongHungaryIndiaIndonesiaIranIraqIrelandIsraelItalyJamaicaJapanJordanKazakhstanKenyaKoreaKuwaitLaosLatin AmericaLatviaLebanonLiberiaLithuaniaMalaysiaMexicoMicronesiaMiddle AfricaMoldovaMoroccoNepalNetherlandsNicaraguaNigeriaNorth AmericaNorth MacedoniaNorthern AfricaNorthern EuropeNorwayOceaniaPakistanPanamaPeruPhilippinesPolandPortugalRomaniaRussiaSaudi ArabiaScotlandSenegalSerbiaSierra LeoneSingaporeSomaliaSouth AfricaSouth AmericaSouth Central AsiaSouth Eastern AsiaSouthern EuropeSpainSri LankaSt. Vincent and the GrenadinesSudanSwedenSwitzerlandSyriaTaiwanThailandTrinidad and TobagoTurkeyUgandaUkraineUruguayUzbekistanVenezuelaVietnamWest IndiesWestern AfricaWestern AsiaWestern EuropeYemenZaireZimbabweAzores
Median Household Income
Income
Poverty
Unemployment
Labor Participation
Family Structure
Vehicle Availability
Education Level
Disability

Median Household Income Comparison

Scotch-Irish

Ukrainians

Tragic
Exceptional
$80,972
MEDIAN HOUSEHOLD INCOME
6.6/ 100
METRIC RATING
225th/ 347
METRIC RANK
$91,456
MEDIAN HOUSEHOLD INCOME
98.3/ 100
METRIC RATING
100th/ 347
METRIC RANK

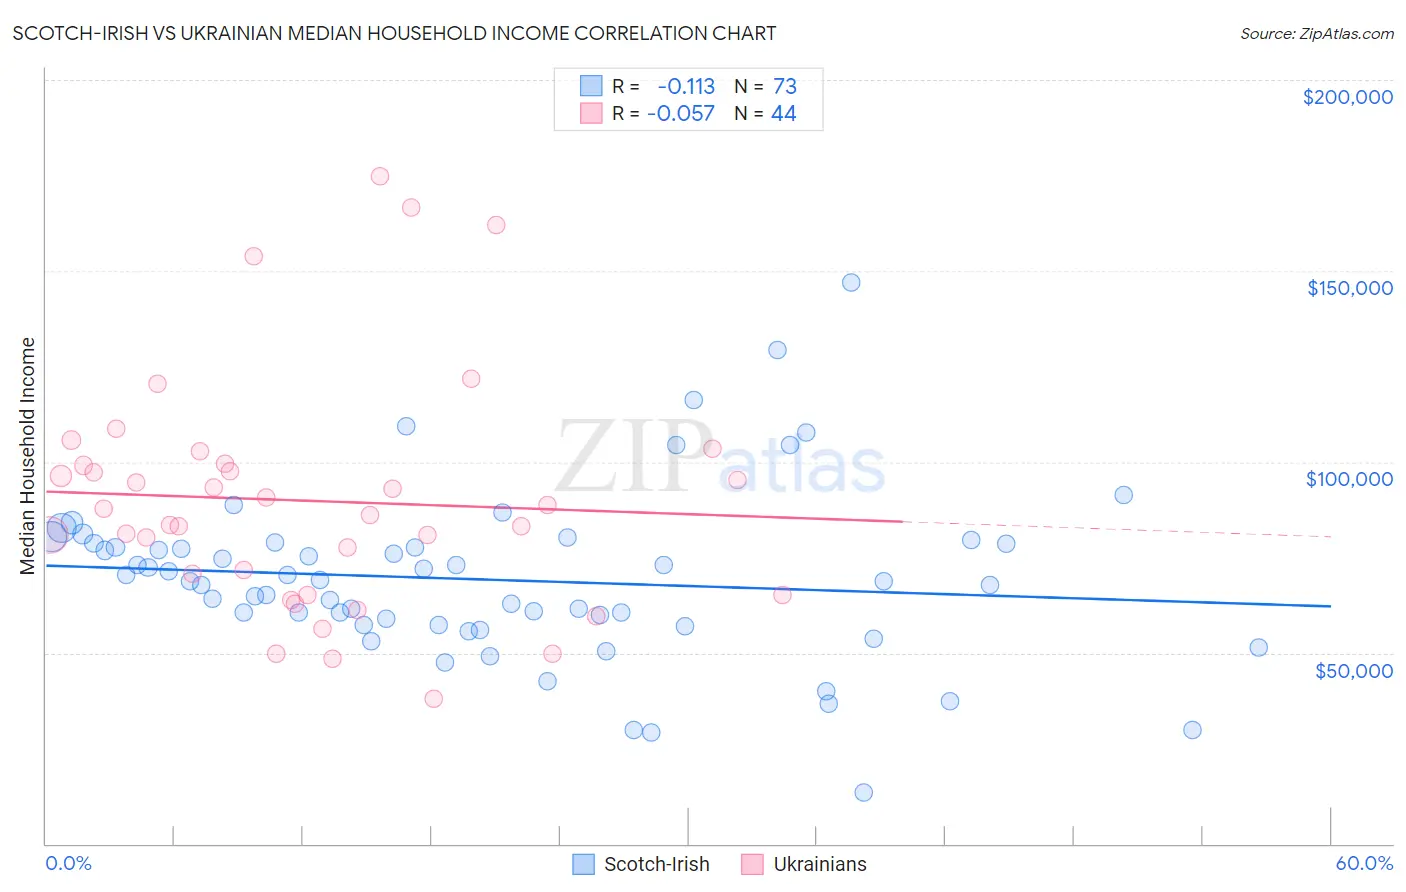
Scotch-Irish vs Ukrainian Median Household Income Correlation Chart

The statistical analysis conducted on geographies consisting of 548,026,119 people shows a poor negative correlation between the proportion of Scotch-Irish and median household income in the United States with a correlation coefficient (R) of -0.113 and weighted average of $80,972. Similarly, the statistical analysis conducted on geographies consisting of 448,198,646 people shows a slight negative correlation between the proportion of Ukrainians and median household income in the United States with a correlation coefficient (R) of -0.057 and weighted average of $91,456, a difference of 13.0%.
Scotch-Irish vs Ukrainian Median Household Income

Median Household Income Correlation Summary

MeasurementScotch-IrishUkrainian
Minimum$13,333$37,811
Maximum$146,875$174,670
Range$133,542$136,859
Mean$69,187$89,793
Median$68,778$86,791
Interquartile 25% (IQ1)$57,401$67,812
Interquartile 75% (IQ3)$78,673$99,299
Interquartile Range (IQR)$21,272$31,486
Standard Deviation (Sample)$22,180$30,572
Standard Deviation (Population)$22,027$30,223

Similar Demographics by Median Household Income

Demographics Similar to Scotch-Irish by Median Household Income

In terms of median household income, the demographic groups most similar to Scotch-Irish are Malaysian ($81,064, a difference of 0.11%), Immigrants from Panama ($80,873, a difference of 0.12%), Guyanese ($80,734, a difference of 0.29%), Immigrants from El Salvador ($81,213, a difference of 0.30%), and Immigrants from Bangladesh ($80,722, a difference of 0.31%).
DemographicsRating | RankMedian Household Income
Whites/Caucasians
12.2
/100
|
#218
Poor
$82,029
Nigerians
10.3
/100
|
#219
Poor
$81,725
Immigrants | Venezuela
9.0
/100
|
#220
Tragic
$81,506
Immigrants | Ghana
9.0
/100
|
#221
Tragic
$81,489
Immigrants | Nigeria
7.7
/100
|
#222
Tragic
$81,236
Immigrants | El Salvador
7.6
/100
|
#223
Tragic
$81,213
Malaysians
7.0
/100
|
#224
Tragic
$81,064
Scotch-Irish
6.6
/100
|
#225
Tragic
$80,972
Immigrants | Panama
6.2
/100
|
#226
Tragic
$80,873
Guyanese
5.7
/100
|
#227
Tragic
$80,734
Immigrants | Bangladesh
5.7
/100
|
#228
Tragic
$80,722
Delaware
5.0
/100
|
#229
Tragic
$80,527
Bermudans
4.7
/100
|
#230
Tragic
$80,406
Trinidadians and Tobagonians
4.7
/100
|
#231
Tragic
$80,402
Immigrants | Trinidad and Tobago
4.6
/100
|
#232
Tragic
$80,373

Demographics Similar to Ukrainians by Median Household Income

In terms of median household income, the demographic groups most similar to Ukrainians are Immigrants from Moldova ($91,446, a difference of 0.010%), Immigrants from South Eastern Asia ($91,541, a difference of 0.090%), Austrian ($91,339, a difference of 0.13%), Immigrants from Southern Europe ($91,605, a difference of 0.16%), and Immigrants from Serbia ($91,730, a difference of 0.30%).
DemographicsRating | RankMedian Household Income
Immigrants | Lebanon
98.7
/100
|
#93
Exceptional
$91,887
Immigrants | North America
98.7
/100
|
#94
Exceptional
$91,860
Armenians
98.7
/100
|
#95
Exceptional
$91,807
Jordanians
98.7
/100
|
#96
Exceptional
$91,794
Immigrants | Serbia
98.6
/100
|
#97
Exceptional
$91,730
Immigrants | Southern Europe
98.5
/100
|
#98
Exceptional
$91,605
Immigrants | South Eastern Asia
98.4
/100
|
#99
Exceptional
$91,541
Ukrainians
98.3
/100
|
#100
Exceptional
$91,456
Immigrants | Moldova
98.3
/100
|
#101
Exceptional
$91,446
Austrians
98.2
/100
|
#102
Exceptional
$91,339
Immigrants | Ukraine
98.0
/100
|
#103
Exceptional
$91,124
Immigrants | Kazakhstan
97.8
/100
|
#104
Exceptional
$91,015
Immigrants | Brazil
97.7
/100
|
#105
Exceptional
$90,907
Macedonians
97.4
/100
|
#106
Exceptional
$90,761
Croatians
97.3
/100
|
#107
Exceptional
$90,685