Salvadoran vs Immigrants from Nepal Median Household Income
COMPARE
Salvadoran
Immigrants from Nepal
Median Household Income
Median Household Income Comparison
Salvadorans
Immigrants from Nepal
$82,449
MEDIAN HOUSEHOLD INCOME
15.4/ 100
METRIC RATING
211th/ 347
METRIC RANK
$87,046
MEDIAN HOUSEHOLD INCOME
77.7/ 100
METRIC RATING
149th/ 347
METRIC RANK
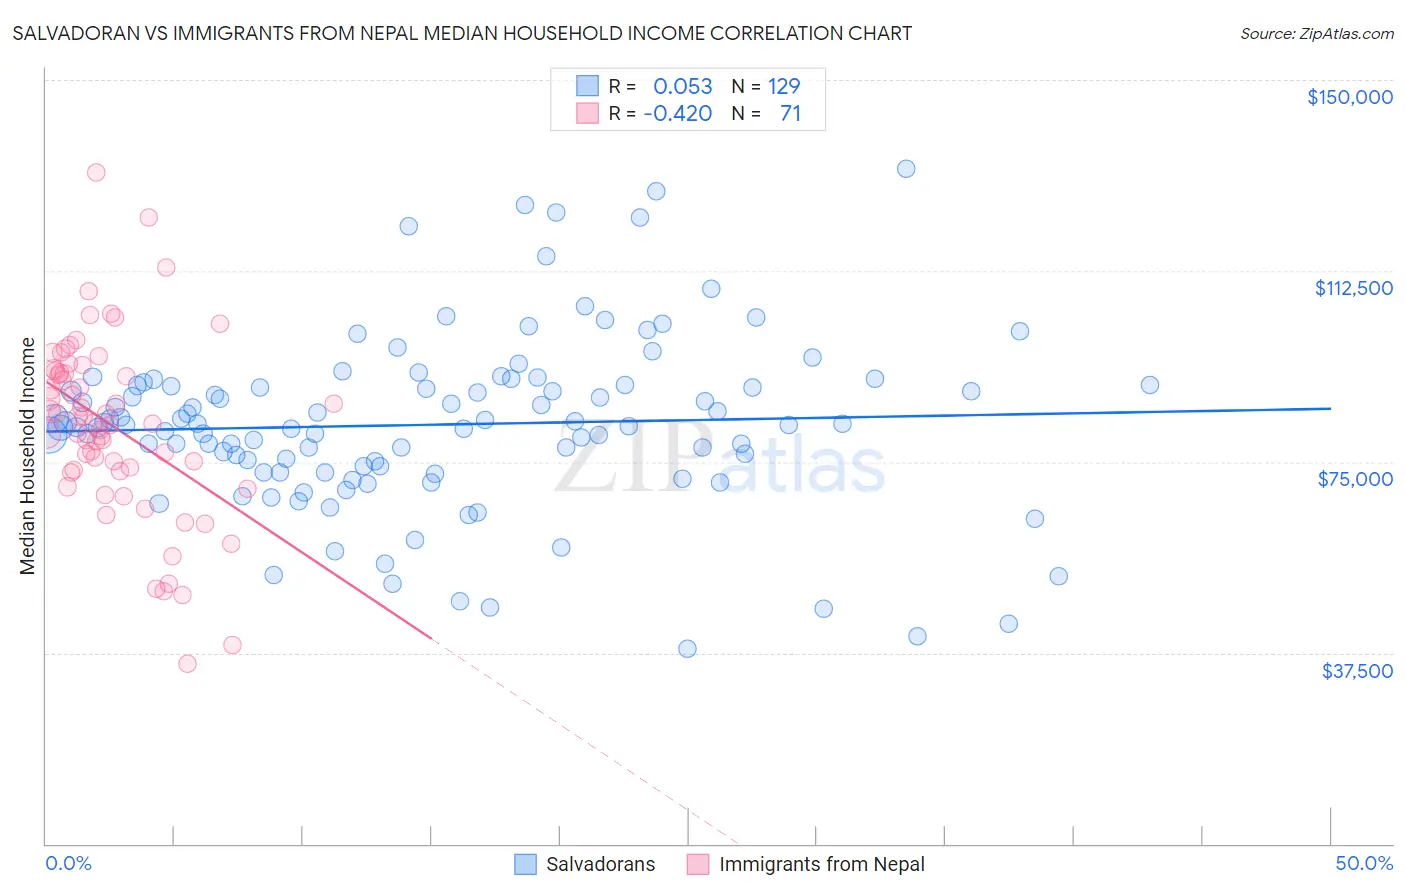
Salvadoran vs Immigrants from Nepal Median Household Income Correlation Chart
The statistical analysis conducted on geographies consisting of 398,609,851 people shows a slight positive correlation between the proportion of Salvadorans and median household income in the United States with a correlation coefficient (R) of 0.053 and weighted average of $82,449. Similarly, the statistical analysis conducted on geographies consisting of 186,662,148 people shows a moderate negative correlation between the proportion of Immigrants from Nepal and median household income in the United States with a correlation coefficient (R) of -0.420 and weighted average of $87,046, a difference of 5.6%.
Median Household Income Correlation Summary
| Measurement | Salvadoran | Immigrants from Nepal |
| Minimum | $38,281 | $35,329 |
| Maximum | $132,625 | $131,777 |
| Range | $94,344 | $96,448 |
| Mean | $82,302 | $81,976 |
| Median | $82,350 | $82,737 |
| Interquartile 25% (IQ1) | $73,617 | $73,125 |
| Interquartile 75% (IQ3) | $90,029 | $92,873 |
| Interquartile Range (IQR) | $16,412 | $19,748 |
| Standard Deviation (Sample) | $17,071 | $17,803 |
| Standard Deviation (Population) | $17,005 | $17,677 |
Similar Demographics by Median Household Income
Demographics Similar to Salvadorans by Median Household Income
In terms of median household income, the demographic groups most similar to Salvadorans are Venezuelan ($82,432, a difference of 0.020%), Nepalese ($82,410, a difference of 0.050%), Immigrants from Uruguay ($82,560, a difference of 0.14%), Immigrants from Iraq ($82,594, a difference of 0.18%), and Panamanian ($82,272, a difference of 0.22%).
| Demographics | Rating | Rank | Median Household Income |
| Immigrants | Africa | 23.8 /100 | #204 | Fair $83,289 |
| Celtics | 22.7 /100 | #205 | Fair $83,193 |
| Immigrants | Kenya | 21.3 /100 | #206 | Fair $83,068 |
| Dutch | 20.3 /100 | #207 | Fair $82,971 |
| French Canadians | 18.7 /100 | #208 | Poor $82,810 |
| Immigrants | Iraq | 16.7 /100 | #209 | Poor $82,594 |
| Immigrants | Uruguay | 16.4 /100 | #210 | Poor $82,560 |
| Salvadorans | 15.4 /100 | #211 | Poor $82,449 |
| Venezuelans | 15.3 /100 | #212 | Poor $82,432 |
| Nepalese | 15.1 /100 | #213 | Poor $82,410 |
| Panamanians | 14.0 /100 | #214 | Poor $82,272 |
| Vietnamese | 13.8 /100 | #215 | Poor $82,248 |
| Yugoslavians | 13.3 /100 | #216 | Poor $82,186 |
| Ecuadorians | 12.5 /100 | #217 | Poor $82,070 |
| Whites/Caucasians | 12.2 /100 | #218 | Poor $82,029 |
Demographics Similar to Immigrants from Nepal by Median Household Income
In terms of median household income, the demographic groups most similar to Immigrants from Nepal are Basque ($87,001, a difference of 0.050%), Hungarian ($86,920, a difference of 0.15%), Immigrants from Saudi Arabia ($86,875, a difference of 0.20%), Costa Rican ($87,262, a difference of 0.25%), and South American ($86,824, a difference of 0.26%).
| Demographics | Rating | Rank | Median Household Income |
| Canadians | 84.7 /100 | #142 | Excellent $87,769 |
| Danes | 83.9 /100 | #143 | Excellent $87,676 |
| Serbians | 83.0 /100 | #144 | Excellent $87,572 |
| Ugandans | 82.9 /100 | #145 | Excellent $87,557 |
| Immigrants | Uganda | 82.8 /100 | #146 | Excellent $87,553 |
| South American Indians | 81.8 /100 | #147 | Excellent $87,446 |
| Costa Ricans | 80.0 /100 | #148 | Excellent $87,262 |
| Immigrants | Nepal | 77.7 /100 | #149 | Good $87,046 |
| Basques | 77.2 /100 | #150 | Good $87,001 |
| Hungarians | 76.3 /100 | #151 | Good $86,920 |
| Immigrants | Saudi Arabia | 75.8 /100 | #152 | Good $86,875 |
| South Americans | 75.1 /100 | #153 | Good $86,824 |
| Immigrants | Germany | 74.4 /100 | #154 | Good $86,764 |
| Carpatho Rusyns | 72.8 /100 | #155 | Good $86,635 |
| Immigrants | Albania | 71.5 /100 | #156 | Good $86,534 |