Puerto Rican vs Immigrants from France Median Family Income
COMPARE
Puerto Rican
Immigrants from France
Median Family Income
Median Family Income Comparison
Puerto Ricans
Immigrants from France
$70,423
MEDIAN FAMILY INCOME
0.0/ 100
METRIC RATING
346th/ 347
METRIC RANK
$120,076
MEDIAN FAMILY INCOME
100.0/ 100
METRIC RATING
31st/ 347
METRIC RANK
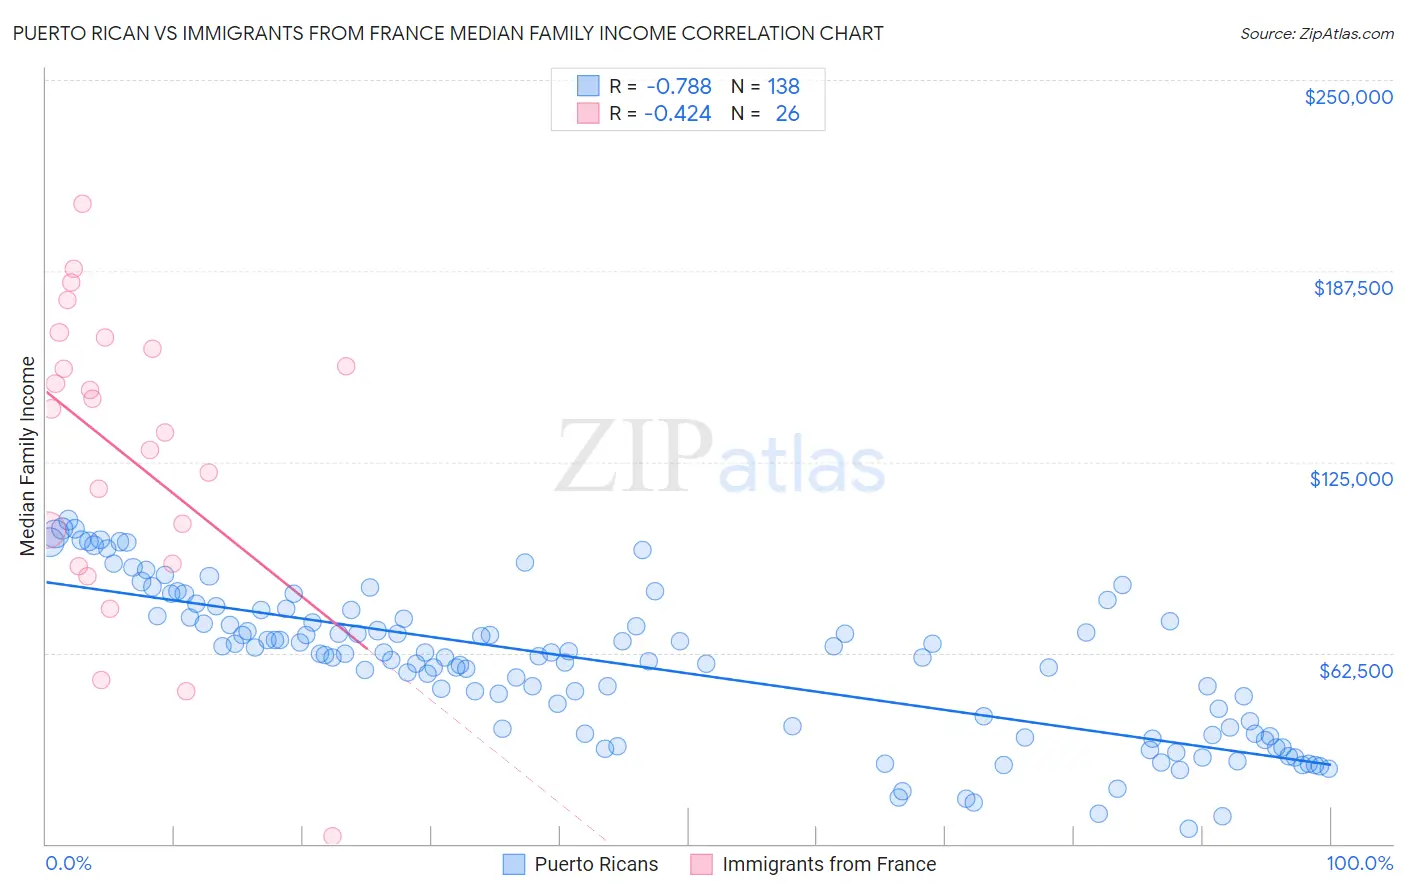
Puerto Rican vs Immigrants from France Median Family Income Correlation Chart
The statistical analysis conducted on geographies consisting of 527,319,729 people shows a strong negative correlation between the proportion of Puerto Ricans and median family income in the United States with a correlation coefficient (R) of -0.788 and weighted average of $70,423. Similarly, the statistical analysis conducted on geographies consisting of 287,827,104 people shows a moderate negative correlation between the proportion of Immigrants from France and median family income in the United States with a correlation coefficient (R) of -0.424 and weighted average of $120,076, a difference of 70.5%.
Median Family Income Correlation Summary
| Measurement | Puerto Rican | Immigrants from France |
| Minimum | $5,070 | $2,499 |
| Maximum | $105,977 | $209,360 |
| Range | $100,907 | $206,861 |
| Mean | $59,210 | $127,499 |
| Median | $62,177 | $138,617 |
| Interquartile 25% (IQ1) | $37,461 | $91,458 |
| Interquartile 75% (IQ3) | $74,478 | $162,000 |
| Interquartile Range (IQR) | $37,017 | $70,542 |
| Standard Deviation (Sample) | $24,299 | $48,457 |
| Standard Deviation (Population) | $24,211 | $47,516 |
Similar Demographics by Median Family Income
Demographics Similar to Puerto Ricans by Median Family Income
In terms of median family income, the demographic groups most similar to Puerto Ricans are Navajo ($70,989, a difference of 0.80%), Tohono O'odham ($72,193, a difference of 2.5%), Lumbee ($68,679, a difference of 2.5%), Houma ($76,188, a difference of 8.2%), and Crow ($76,605, a difference of 8.8%).
| Demographics | Rating | Rank | Median Family Income |
| Kiowa | 0.0 /100 | #333 | Tragic $80,885 |
| Menominee | 0.0 /100 | #334 | Tragic $79,563 |
| Yup'ik | 0.0 /100 | #335 | Tragic $79,290 |
| Immigrants | Cuba | 0.0 /100 | #336 | Tragic $78,249 |
| Yuman | 0.0 /100 | #337 | Tragic $78,055 |
| Immigrants | Yemen | 0.0 /100 | #338 | Tragic $77,457 |
| Pima | 0.0 /100 | #339 | Tragic $77,431 |
| Hopi | 0.0 /100 | #340 | Tragic $77,188 |
| Pueblo | 0.0 /100 | #341 | Tragic $76,880 |
| Crow | 0.0 /100 | #342 | Tragic $76,605 |
| Houma | 0.0 /100 | #343 | Tragic $76,188 |
| Tohono O'odham | 0.0 /100 | #344 | Tragic $72,193 |
| Navajo | 0.0 /100 | #345 | Tragic $70,989 |
| Puerto Ricans | 0.0 /100 | #346 | Tragic $70,423 |
| Lumbee | 0.0 /100 | #347 | Tragic $68,679 |
Demographics Similar to Immigrants from France by Median Family Income
In terms of median family income, the demographic groups most similar to Immigrants from France are Asian ($119,955, a difference of 0.10%), Immigrants from Sri Lanka ($120,263, a difference of 0.16%), Latvian ($120,301, a difference of 0.19%), Bhutanese ($119,800, a difference of 0.23%), and Immigrants from Denmark ($120,445, a difference of 0.31%).
| Demographics | Rating | Rank | Median Family Income |
| Immigrants | Northern Europe | 100.0 /100 | #24 | Exceptional $121,840 |
| Turks | 100.0 /100 | #25 | Exceptional $121,202 |
| Immigrants | Switzerland | 100.0 /100 | #26 | Exceptional $120,726 |
| Russians | 100.0 /100 | #27 | Exceptional $120,487 |
| Immigrants | Denmark | 100.0 /100 | #28 | Exceptional $120,445 |
| Latvians | 100.0 /100 | #29 | Exceptional $120,301 |
| Immigrants | Sri Lanka | 100.0 /100 | #30 | Exceptional $120,263 |
| Immigrants | France | 100.0 /100 | #31 | Exceptional $120,076 |
| Asians | 100.0 /100 | #32 | Exceptional $119,955 |
| Bhutanese | 100.0 /100 | #33 | Exceptional $119,800 |
| Bolivians | 100.0 /100 | #34 | Exceptional $119,479 |
| Soviet Union | 100.0 /100 | #35 | Exceptional $119,262 |
| Israelis | 100.0 /100 | #36 | Exceptional $118,577 |
| Australians | 100.0 /100 | #37 | Exceptional $118,440 |
| Immigrants | Turkey | 100.0 /100 | #38 | Exceptional $118,325 |