Czech vs Immigrants from France Median Family Income

COMPARE

Czech
Race
Ancestry
AfghanAfricanAlaska NativeAlaskan AthabascanAlbanianAleutAlsatianAmericanApacheArabArapahoArgentineanArmenianAssyrian/Chaldean/SyriacAustralianAustrianBahamianBangladeshiBarbadianBasqueBelgianBelizeanBermudanBhutaneseBlackfeetBolivianBrazilianBritishBritish West IndianBulgarianBurmeseCajunCambodianCanadianCape VerdeanCarpatho RusynCelticCentral AmericanCentral American IndianCherokeeCheyenneChickasawChileanChineseChippewaChoctawColombianColvilleComancheCosta RicanCreeCreekCroatianCrowCubanCypriotCzechCzechoslovakianDanishDelawareDominicanDutchDutch West IndianEastern EuropeanEcuadorianEgyptianEnglishEstonianEthiopianEuropeanFijianFilipinoFinnishFrenchFrench American IndianFrench CanadianGermanGerman RussianGhanaianGreekGuamanian/ChamorroGuatemalanGuyaneseHaitianHmongHonduranHopiHoumaHungarianIcelanderIndian (Asian)IndonesianInupiatIranianIraqiIrishIroquoisIsraeliItalianJamaicanJapaneseJordanianKenyanKiowaKoreanLaotianLatvianLebaneseLiberianLithuanianLumbeeLuxembourgerMacedonianMalaysianMalteseMarshalleseMenomineeMexicanMexican American IndianMongolianMoroccanNative HawaiianNavajoNepaleseNew ZealanderNicaraguanNigerianNorthern EuropeanNorwegianOkinawanOsageOttawaPaiutePakistaniPalestinianPanamanianParaguayanPennsylvania GermanPeruvianPimaPolishPortuguesePotawatomiPuebloPuerto RicanPuget Sound SalishRomanianRussianSalvadoranSamoanScandinavianScotch-IrishScottishSeminoleSenegaleseSerbianShoshoneSierra LeoneanSiouxSlavicSlovakSloveneSomaliSouth AfricanSouth AmericanSouth American IndianSoviet UnionSpaniardSpanishSpanish AmericanSpanish American IndianSri LankanSubsaharan AfricanSudaneseSwedishSwissSyrianTaiwaneseThaiTlingit-HaidaTohono O'OdhamTonganTrinidadian and TobagonianTsimshianTurkishU.S. Virgin IslanderUgandanUkrainianUruguayanUteVenezuelanVietnameseWelshWest IndianYakamaYaquiYugoslavianYumanYup'ikZimbabwean
Immigration
NonimmigrantsImmigrantsAfghanistanAfricaAlbaniaArgentinaArmeniaAsiaAustraliaAustriaBahamasBangladeshBarbadosBelarusBelgiumBelizeBoliviaBosnia and HerzegovinaBrazilBulgariaBurma/MyanmarCabo VerdeCambodiaCameroonCanadaCaribbeanCentral AmericaChileChinaColombiaCongoCosta RicaCroatiaCubaCzechoslovakiaDenmarkDominicaDominican RepublicEastern AfricaEastern AsiaEastern EuropeEcuadorEgyptEl SalvadorEnglandEritreaEthiopiaEuropeFijiGermanyGhanaGreeceGrenadaGuatemalaGuyanaHaitiHondurasHong KongHungaryIndiaIndonesiaIranIraqIrelandIsraelItalyJamaicaJapanJordanKazakhstanKenyaKoreaKuwaitLaosLatin AmericaLatviaLebanonLiberiaLithuaniaMalaysiaMexicoMicronesiaMiddle AfricaMoldovaMoroccoNepalNetherlandsNicaraguaNigeriaNorth AmericaNorth MacedoniaNorthern AfricaNorthern EuropeNorwayOceaniaPakistanPanamaPeruPhilippinesPolandPortugalRomaniaRussiaSaudi ArabiaScotlandSenegalSerbiaSierra LeoneSingaporeSomaliaSouth AfricaSouth AmericaSouth Central AsiaSouth Eastern AsiaSouthern EuropeSpainSri LankaSt. Vincent and the GrenadinesSudanSwedenSwitzerlandSyriaTaiwanThailandTrinidad and TobagoTurkeyUgandaUkraineUruguayUzbekistanVenezuelaVietnamWest IndiesWestern AfricaWestern AsiaWestern EuropeYemenZaireZimbabweAzores
Immigrants from France
Race
Ancestry
AfghanAfricanAlaska NativeAlaskan AthabascanAlbanianAleutAlsatianAmericanApacheArabArapahoArgentineanArmenianAssyrian/Chaldean/SyriacAustralianAustrianBahamianBangladeshiBarbadianBasqueBelgianBelizeanBermudanBhutaneseBlackfeetBolivianBrazilianBritishBritish West IndianBulgarianBurmeseCajunCambodianCanadianCape VerdeanCarpatho RusynCelticCentral AmericanCentral American IndianCherokeeCheyenneChickasawChileanChineseChippewaChoctawColombianColvilleComancheCosta RicanCreeCreekCroatianCrowCubanCypriotCzechoslovakianDanishDelawareDominicanDutchDutch West IndianEastern EuropeanEcuadorianEgyptianEnglishEstonianEthiopianEuropeanFijianFilipinoFinnishFrenchFrench American IndianFrench CanadianGermanGerman RussianGhanaianGreekGuamanian/ChamorroGuatemalanGuyaneseHaitianHmongHonduranHopiHoumaHungarianIcelanderIndian (Asian)IndonesianInupiatIranianIraqiIrishIroquoisIsraeliItalianJamaicanJapaneseJordanianKenyanKiowaKoreanLaotianLatvianLebaneseLiberianLithuanianLumbeeLuxembourgerMacedonianMalaysianMalteseMarshalleseMenomineeMexicanMexican American IndianMongolianMoroccanNative HawaiianNavajoNepaleseNew ZealanderNicaraguanNigerianNorthern EuropeanNorwegianOkinawanOsageOttawaPaiutePakistaniPalestinianPanamanianParaguayanPennsylvania GermanPeruvianPimaPolishPortuguesePotawatomiPuebloPuerto RicanPuget Sound SalishRomanianRussianSalvadoranSamoanScandinavianScotch-IrishScottishSeminoleSenegaleseSerbianShoshoneSierra LeoneanSiouxSlavicSlovakSloveneSomaliSouth AfricanSouth AmericanSouth American IndianSoviet UnionSpaniardSpanishSpanish AmericanSpanish American IndianSri LankanSubsaharan AfricanSudaneseSwedishSwissSyrianTaiwaneseThaiTlingit-HaidaTohono O'OdhamTonganTrinidadian and TobagonianTsimshianTurkishU.S. Virgin IslanderUgandanUkrainianUruguayanUteVenezuelanVietnameseWelshWest IndianYakamaYaquiYugoslavianYumanYup'ikZimbabwean
Immigration
NonimmigrantsImmigrantsAfghanistanAfricaAlbaniaArgentinaArmeniaAsiaAustraliaAustriaBahamasBangladeshBarbadosBelarusBelgiumBelizeBoliviaBosnia and HerzegovinaBrazilBulgariaBurma/MyanmarCabo VerdeCambodiaCameroonCanadaCaribbeanCentral AmericaChileChinaColombiaCongoCosta RicaCroatiaCubaCzechoslovakiaDenmarkDominicaDominican RepublicEastern AfricaEastern AsiaEastern EuropeEcuadorEgyptEl SalvadorEnglandEritreaEthiopiaEuropeFijiFranceGermanyGhanaGreeceGrenadaGuatemalaGuyanaHaitiHondurasHong KongHungaryIndiaIndonesiaIranIraqIrelandIsraelItalyJamaicaJapanJordanKazakhstanKenyaKoreaKuwaitLaosLatin AmericaLatviaLebanonLiberiaLithuaniaMalaysiaMexicoMicronesiaMiddle AfricaMoldovaMoroccoNepalNetherlandsNicaraguaNigeriaNorth AmericaNorth MacedoniaNorthern AfricaNorthern EuropeNorwayOceaniaPakistanPanamaPeruPhilippinesPolandPortugalRomaniaRussiaSaudi ArabiaScotlandSenegalSerbiaSierra LeoneSingaporeSomaliaSouth AfricaSouth AmericaSouth Central AsiaSouth Eastern AsiaSouthern EuropeSpainSri LankaSt. Vincent and the GrenadinesSudanSwedenSwitzerlandSyriaTaiwanThailandTrinidad and TobagoTurkeyUgandaUkraineUruguayUzbekistanVenezuelaVietnamWest IndiesWestern AfricaWestern AsiaWestern EuropeYemenZaireZimbabweAzores
Median Family Income
Income
Poverty
Unemployment
Labor Participation
Family Structure
Vehicle Availability
Education Level
Disability

Median Family Income Comparison

Czechs

Immigrants from France

Excellent
Exceptional
$105,839
MEDIAN FAMILY INCOME
83.4/ 100
METRIC RATING
146th/ 347
METRIC RANK
$120,076
MEDIAN FAMILY INCOME
100.0/ 100
METRIC RATING
31st/ 347
METRIC RANK

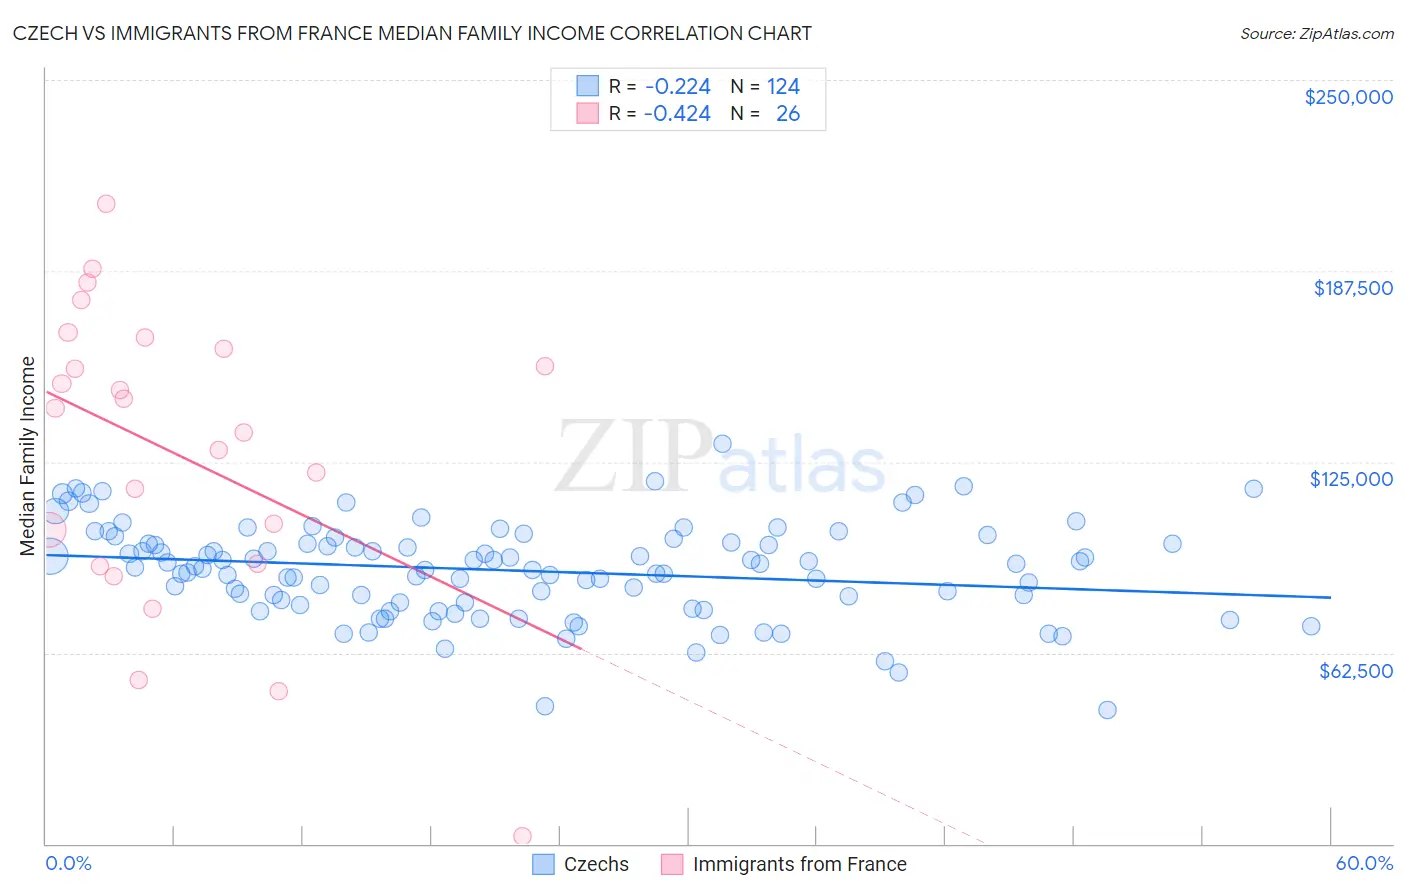
Czech vs Immigrants from France Median Family Income Correlation Chart

The statistical analysis conducted on geographies consisting of 484,215,939 people shows a weak negative correlation between the proportion of Czechs and median family income in the United States with a correlation coefficient (R) of -0.224 and weighted average of $105,839. Similarly, the statistical analysis conducted on geographies consisting of 287,827,104 people shows a moderate negative correlation between the proportion of Immigrants from France and median family income in the United States with a correlation coefficient (R) of -0.424 and weighted average of $120,076, a difference of 13.5%.
Czech vs Immigrants from France Median Family Income

Median Family Income Correlation Summary

MeasurementCzechImmigrants from France
Minimum$43,750$2,499
Maximum$130,730$209,360
Range$86,980$206,861
Mean$89,458$127,499
Median$90,621$138,617
Interquartile 25% (IQ1)$79,002$91,458
Interquartile 75% (IQ3)$98,480$162,000
Interquartile Range (IQR)$19,478$70,542
Standard Deviation (Sample)$15,413$48,457
Standard Deviation (Population)$15,350$47,516

Similar Demographics by Median Family Income

Demographics Similar to Czechs by Median Family Income

In terms of median family income, the demographic groups most similar to Czechs are Danish ($105,900, a difference of 0.060%), Tongan ($105,967, a difference of 0.12%), Immigrants from Morocco ($105,964, a difference of 0.12%), Slovene ($106,020, a difference of 0.17%), and Immigrants from Chile ($105,655, a difference of 0.17%).
DemographicsRating | RankMedian Family Income
Luxembourgers
85.7
/100
|
#139
Excellent
$106,183
Norwegians
85.5
/100
|
#140
Excellent
$106,144
Immigrants | Syria
85.3
/100
|
#141
Excellent
$106,118
Slovenes
84.7
/100
|
#142
Excellent
$106,020
Tongans
84.3
/100
|
#143
Excellent
$105,967
Immigrants | Morocco
84.3
/100
|
#144
Excellent
$105,964
Danes
83.8
/100
|
#145
Excellent
$105,900
Czechs
83.4
/100
|
#146
Excellent
$105,839
Immigrants | Chile
82.1
/100
|
#147
Excellent
$105,655
Hungarians
81.7
/100
|
#148
Excellent
$105,609
Immigrants | Germany
80.9
/100
|
#149
Excellent
$105,507
Irish
80.5
/100
|
#150
Excellent
$105,453
Peruvians
80.4
/100
|
#151
Excellent
$105,444
Immigrants | Albania
79.1
/100
|
#152
Good
$105,285
Slavs
77.9
/100
|
#153
Good
$105,144

Demographics Similar to Immigrants from France by Median Family Income

In terms of median family income, the demographic groups most similar to Immigrants from France are Asian ($119,955, a difference of 0.10%), Immigrants from Sri Lanka ($120,263, a difference of 0.16%), Latvian ($120,301, a difference of 0.19%), Bhutanese ($119,800, a difference of 0.23%), and Immigrants from Denmark ($120,445, a difference of 0.31%).
DemographicsRating | RankMedian Family Income
Immigrants | Northern Europe
100.0
/100
|
#24
Exceptional
$121,840
Turks
100.0
/100
|
#25
Exceptional
$121,202
Immigrants | Switzerland
100.0
/100
|
#26
Exceptional
$120,726
Russians
100.0
/100
|
#27
Exceptional
$120,487
Immigrants | Denmark
100.0
/100
|
#28
Exceptional
$120,445
Latvians
100.0
/100
|
#29
Exceptional
$120,301
Immigrants | Sri Lanka
100.0
/100
|
#30
Exceptional
$120,263
Immigrants | France
100.0
/100
|
#31
Exceptional
$120,076
Asians
100.0
/100
|
#32
Exceptional
$119,955
Bhutanese
100.0
/100
|
#33
Exceptional
$119,800
Bolivians
100.0
/100
|
#34
Exceptional
$119,479
Soviet Union
100.0
/100
|
#35
Exceptional
$119,262
Israelis
100.0
/100
|
#36
Exceptional
$118,577
Australians
100.0
/100
|
#37
Exceptional
$118,440
Immigrants | Turkey
100.0
/100
|
#38
Exceptional
$118,325