Potawatomi vs Seminole Median Household Income
COMPARE
Potawatomi
Seminole
Median Household Income
Median Household Income Comparison
Potawatomi
Seminole
$72,576
MEDIAN HOUSEHOLD INCOME
0.0/ 100
METRIC RATING
306th/ 347
METRIC RANK
$69,420
MEDIAN HOUSEHOLD INCOME
0.0/ 100
METRIC RATING
325th/ 347
METRIC RANK
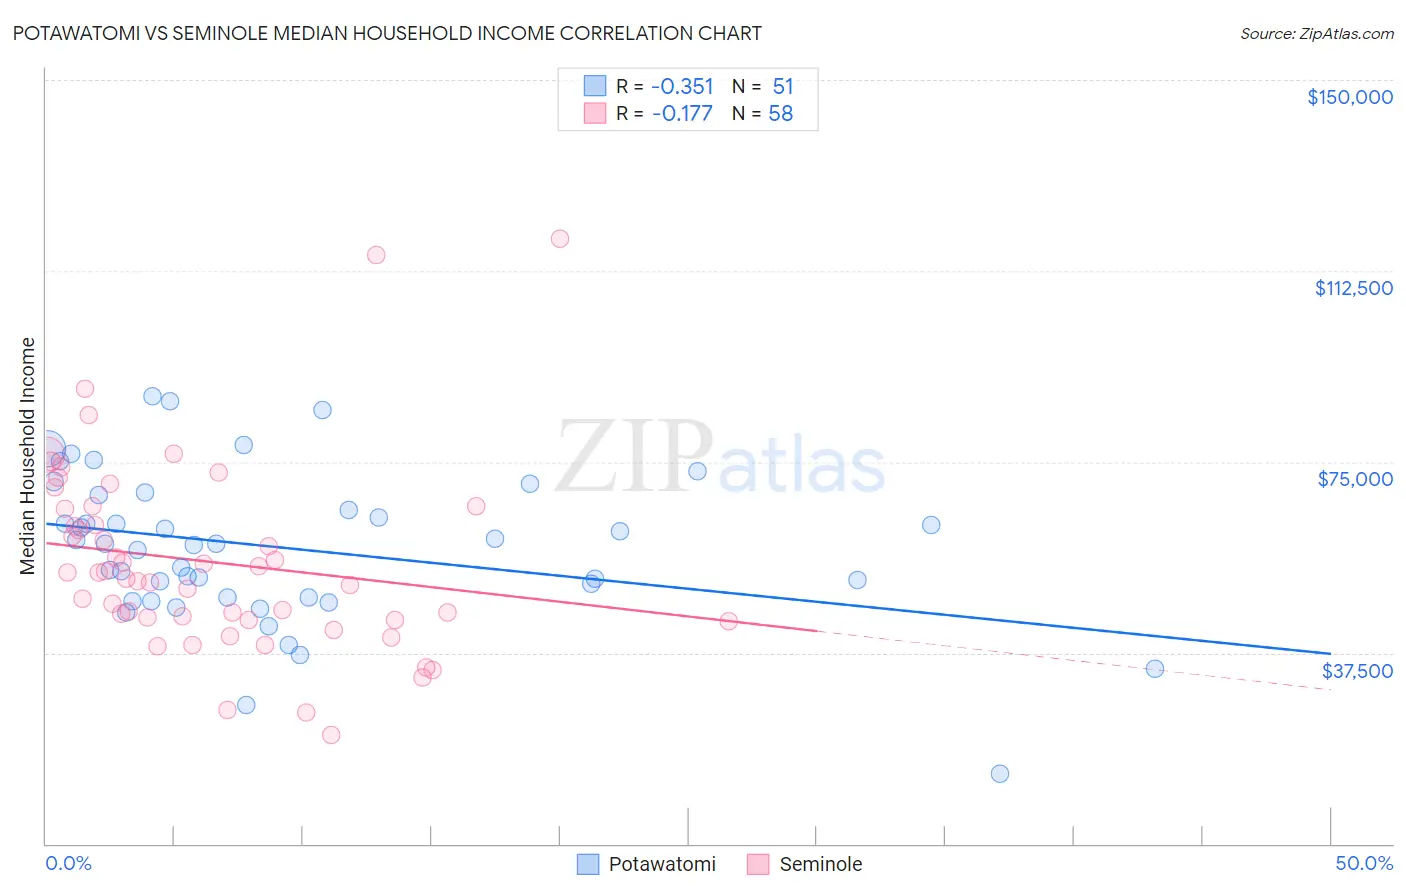
Potawatomi vs Seminole Median Household Income Correlation Chart
The statistical analysis conducted on geographies consisting of 117,750,018 people shows a mild negative correlation between the proportion of Potawatomi and median household income in the United States with a correlation coefficient (R) of -0.351 and weighted average of $72,576. Similarly, the statistical analysis conducted on geographies consisting of 118,297,671 people shows a poor negative correlation between the proportion of Seminole and median household income in the United States with a correlation coefficient (R) of -0.177 and weighted average of $69,420, a difference of 4.5%.
Median Household Income Correlation Summary
| Measurement | Potawatomi | Seminole |
| Minimum | $13,750 | $21,429 |
| Maximum | $87,880 | $118,750 |
| Range | $74,130 | $97,321 |
| Mean | $58,038 | $55,357 |
| Median | $58,924 | $52,689 |
| Interquartile 25% (IQ1) | $48,403 | $44,050 |
| Interquartile 75% (IQ3) | $68,477 | $65,850 |
| Interquartile Range (IQR) | $20,074 | $21,800 |
| Standard Deviation (Sample) | $14,790 | $18,667 |
| Standard Deviation (Population) | $14,645 | $18,505 |
Demographics Similar to Potawatomi and Seminole by Median Household Income
In terms of median household income, the demographic groups most similar to Potawatomi are Honduran ($72,588, a difference of 0.020%), Ute ($72,402, a difference of 0.24%), Yakama ($72,225, a difference of 0.49%), Immigrants from Caribbean ($71,860, a difference of 1.0%), and U.S. Virgin Islander ($71,853, a difference of 1.0%). Similarly, the demographic groups most similar to Seminole are Yup'ik ($69,695, a difference of 0.40%), Bahamian ($69,726, a difference of 0.44%), Choctaw ($69,947, a difference of 0.76%), Chickasaw ($70,005, a difference of 0.84%), and Colville ($70,094, a difference of 0.97%).
| Demographics | Rating | Rank | Median Household Income |
| Hondurans | 0.0 /100 | #305 | Tragic $72,588 |
| Potawatomi | 0.0 /100 | #306 | Tragic $72,576 |
| Ute | 0.0 /100 | #307 | Tragic $72,402 |
| Yakama | 0.0 /100 | #308 | Tragic $72,225 |
| Immigrants | Caribbean | 0.0 /100 | #309 | Tragic $71,860 |
| U.S. Virgin Islanders | 0.0 /100 | #310 | Tragic $71,853 |
| Immigrants | Zaire | 0.0 /100 | #311 | Tragic $71,801 |
| Immigrants | Honduras | 0.0 /100 | #312 | Tragic $71,452 |
| Immigrants | Bahamas | 0.0 /100 | #313 | Tragic $71,349 |
| Dominicans | 0.0 /100 | #314 | Tragic $71,302 |
| Ottawa | 0.0 /100 | #315 | Tragic $70,984 |
| Apache | 0.0 /100 | #316 | Tragic $70,927 |
| Cajuns | 0.0 /100 | #317 | Tragic $70,605 |
| Chippewa | 0.0 /100 | #318 | Tragic $70,539 |
| Immigrants | Dominican Republic | 0.0 /100 | #319 | Tragic $70,208 |
| Colville | 0.0 /100 | #320 | Tragic $70,094 |
| Chickasaw | 0.0 /100 | #321 | Tragic $70,005 |
| Choctaw | 0.0 /100 | #322 | Tragic $69,947 |
| Bahamians | 0.0 /100 | #323 | Tragic $69,726 |
| Yup'ik | 0.0 /100 | #324 | Tragic $69,695 |
| Seminole | 0.0 /100 | #325 | Tragic $69,420 |