Potawatomi vs Bolivian Median Household Income

COMPARE

Potawatomi
Race
Ancestry
AfghanAfricanAlaska NativeAlaskan AthabascanAlbanianAleutAlsatianAmericanApacheArabArapahoArgentineanArmenianAssyrian/Chaldean/SyriacAustralianAustrianBahamianBangladeshiBarbadianBasqueBelgianBelizeanBermudanBhutaneseBlackfeetBrazilianBritishBritish West IndianBulgarianBurmeseCajunCambodianCanadianCape VerdeanCarpatho RusynCelticCentral AmericanCentral American IndianCherokeeCheyenneChickasawChileanChineseChippewaChoctawColombianColvilleComancheCosta RicanCreeCreekCroatianCrowCubanCypriotCzechCzechoslovakianDanishDelawareDominicanDutchDutch West IndianEastern EuropeanEcuadorianEgyptianEnglishEstonianEthiopianEuropeanFijianFilipinoFinnishFrenchFrench American IndianFrench CanadianGermanGerman RussianGhanaianGreekGuamanian/ChamorroGuatemalanGuyaneseHaitianHmongHonduranHopiHoumaHungarianIcelanderIndian (Asian)IndonesianInupiatIranianIraqiIrishIroquoisIsraeliItalianJamaicanJapaneseJordanianKenyanKiowaKoreanLaotianLatvianLebaneseLiberianLithuanianLumbeeLuxembourgerMacedonianMalaysianMalteseMarshalleseMenomineeMexicanMexican American IndianMongolianMoroccanNative HawaiianNavajoNepaleseNew ZealanderNicaraguanNigerianNorthern EuropeanNorwegianOkinawanOsageOttawaPaiutePakistaniPalestinianPanamanianParaguayanPennsylvania GermanPeruvianPimaPolishPortuguesePotawatomiPuebloPuerto RicanPuget Sound SalishRomanianRussianSalvadoranSamoanScandinavianScotch-IrishScottishSeminoleSenegaleseSerbianShoshoneSierra LeoneanSiouxSlavicSlovakSloveneSomaliSouth AfricanSouth AmericanSouth American IndianSoviet UnionSpaniardSpanishSpanish AmericanSpanish American IndianSri LankanSubsaharan AfricanSudaneseSwedishSwissSyrianTaiwaneseThaiTlingit-HaidaTohono O'OdhamTonganTrinidadian and TobagonianTsimshianTurkishU.S. Virgin IslanderUgandanUkrainianUruguayanUteVenezuelanVietnameseWelshWest IndianYakamaYaquiYugoslavianYumanYup'ikZimbabwean
Immigration
NonimmigrantsImmigrantsAfghanistanAfricaAlbaniaArgentinaArmeniaAsiaAustraliaAustriaBahamasBangladeshBarbadosBelarusBelgiumBelizeBoliviaBosnia and HerzegovinaBrazilBulgariaBurma/MyanmarCabo VerdeCambodiaCameroonCanadaCaribbeanCentral AmericaChileChinaColombiaCongoCosta RicaCroatiaCubaCzechoslovakiaDenmarkDominicaDominican RepublicEastern AfricaEastern AsiaEastern EuropeEcuadorEgyptEl SalvadorEnglandEritreaEthiopiaEuropeFijiFranceGermanyGhanaGreeceGrenadaGuatemalaGuyanaHaitiHondurasHong KongHungaryIndiaIndonesiaIranIraqIrelandIsraelItalyJamaicaJapanJordanKazakhstanKenyaKoreaKuwaitLaosLatin AmericaLatviaLebanonLiberiaLithuaniaMalaysiaMexicoMicronesiaMiddle AfricaMoldovaMoroccoNepalNetherlandsNicaraguaNigeriaNorth AmericaNorth MacedoniaNorthern AfricaNorthern EuropeNorwayOceaniaPakistanPanamaPeruPhilippinesPolandPortugalRomaniaRussiaSaudi ArabiaScotlandSenegalSerbiaSierra LeoneSingaporeSomaliaSouth AfricaSouth AmericaSouth Central AsiaSouth Eastern AsiaSouthern EuropeSpainSri LankaSt. Vincent and the GrenadinesSudanSwedenSwitzerlandSyriaTaiwanThailandTrinidad and TobagoTurkeyUgandaUkraineUruguayUzbekistanVenezuelaVietnamWest IndiesWestern AfricaWestern AsiaWestern EuropeYemenZaireZimbabweAzores
Bolivian
Race
Ancestry
AfghanAfricanAlaska NativeAlaskan AthabascanAlbanianAleutAlsatianAmericanApacheArabArapahoArgentineanArmenianAssyrian/Chaldean/SyriacAustralianAustrianBahamianBangladeshiBarbadianBasqueBelgianBelizeanBermudanBhutaneseBlackfeetBolivianBrazilianBritishBritish West IndianBulgarianBurmeseCajunCambodianCanadianCape VerdeanCarpatho RusynCelticCentral AmericanCentral American IndianCherokeeCheyenneChickasawChileanChineseChippewaChoctawColombianColvilleComancheCosta RicanCreeCreekCroatianCrowCubanCypriotCzechCzechoslovakianDanishDelawareDominicanDutchDutch West IndianEastern EuropeanEcuadorianEgyptianEnglishEstonianEthiopianEuropeanFijianFilipinoFinnishFrenchFrench American IndianFrench CanadianGermanGerman RussianGhanaianGreekGuamanian/ChamorroGuatemalanGuyaneseHaitianHmongHonduranHopiHoumaHungarianIcelanderIndian (Asian)IndonesianInupiatIranianIraqiIrishIroquoisIsraeliItalianJamaicanJapaneseJordanianKenyanKiowaKoreanLaotianLatvianLebaneseLiberianLithuanianLumbeeLuxembourgerMacedonianMalaysianMalteseMarshalleseMenomineeMexicanMexican American IndianMongolianMoroccanNative HawaiianNavajoNepaleseNew ZealanderNicaraguanNigerianNorthern EuropeanNorwegianOkinawanOsageOttawaPaiutePakistaniPalestinianPanamanianParaguayanPennsylvania GermanPeruvianPimaPolishPortuguesePuebloPuerto RicanPuget Sound SalishRomanianRussianSalvadoranSamoanScandinavianScotch-IrishScottishSeminoleSenegaleseSerbianShoshoneSierra LeoneanSiouxSlavicSlovakSloveneSomaliSouth AfricanSouth AmericanSouth American IndianSoviet UnionSpaniardSpanishSpanish AmericanSpanish American IndianSri LankanSubsaharan AfricanSudaneseSwedishSwissSyrianTaiwaneseThaiTlingit-HaidaTohono O'OdhamTonganTrinidadian and TobagonianTsimshianTurkishU.S. Virgin IslanderUgandanUkrainianUruguayanUteVenezuelanVietnameseWelshWest IndianYakamaYaquiYugoslavianYumanYup'ikZimbabwean
Immigration
NonimmigrantsImmigrantsAfghanistanAfricaAlbaniaArgentinaArmeniaAsiaAustraliaAustriaBahamasBangladeshBarbadosBelarusBelgiumBelizeBoliviaBosnia and HerzegovinaBrazilBulgariaBurma/MyanmarCabo VerdeCambodiaCameroonCanadaCaribbeanCentral AmericaChileChinaColombiaCongoCosta RicaCroatiaCubaCzechoslovakiaDenmarkDominicaDominican RepublicEastern AfricaEastern AsiaEastern EuropeEcuadorEgyptEl SalvadorEnglandEritreaEthiopiaEuropeFijiFranceGermanyGhanaGreeceGrenadaGuatemalaGuyanaHaitiHondurasHong KongHungaryIndiaIndonesiaIranIraqIrelandIsraelItalyJamaicaJapanJordanKazakhstanKenyaKoreaKuwaitLaosLatin AmericaLatviaLebanonLiberiaLithuaniaMalaysiaMexicoMicronesiaMiddle AfricaMoldovaMoroccoNepalNetherlandsNicaraguaNigeriaNorth AmericaNorth MacedoniaNorthern AfricaNorthern EuropeNorwayOceaniaPakistanPanamaPeruPhilippinesPolandPortugalRomaniaRussiaSaudi ArabiaScotlandSenegalSerbiaSierra LeoneSingaporeSomaliaSouth AfricaSouth AmericaSouth Central AsiaSouth Eastern AsiaSouthern EuropeSpainSri LankaSt. Vincent and the GrenadinesSudanSwedenSwitzerlandSyriaTaiwanThailandTrinidad and TobagoTurkeyUgandaUkraineUruguayUzbekistanVenezuelaVietnamWest IndiesWestern AfricaWestern AsiaWestern EuropeYemenZaireZimbabweAzores
Median Household Income
Income
Poverty
Unemployment
Labor Participation
Family Structure
Vehicle Availability
Education Level
Disability

Median Household Income Comparison

Potawatomi

Bolivians

Tragic
Exceptional
$72,576
MEDIAN HOUSEHOLD INCOME
0.0/ 100
METRIC RATING
306th/ 347
METRIC RANK
$102,195
MEDIAN HOUSEHOLD INCOME
100.0/ 100
METRIC RATING
20th/ 347
METRIC RANK

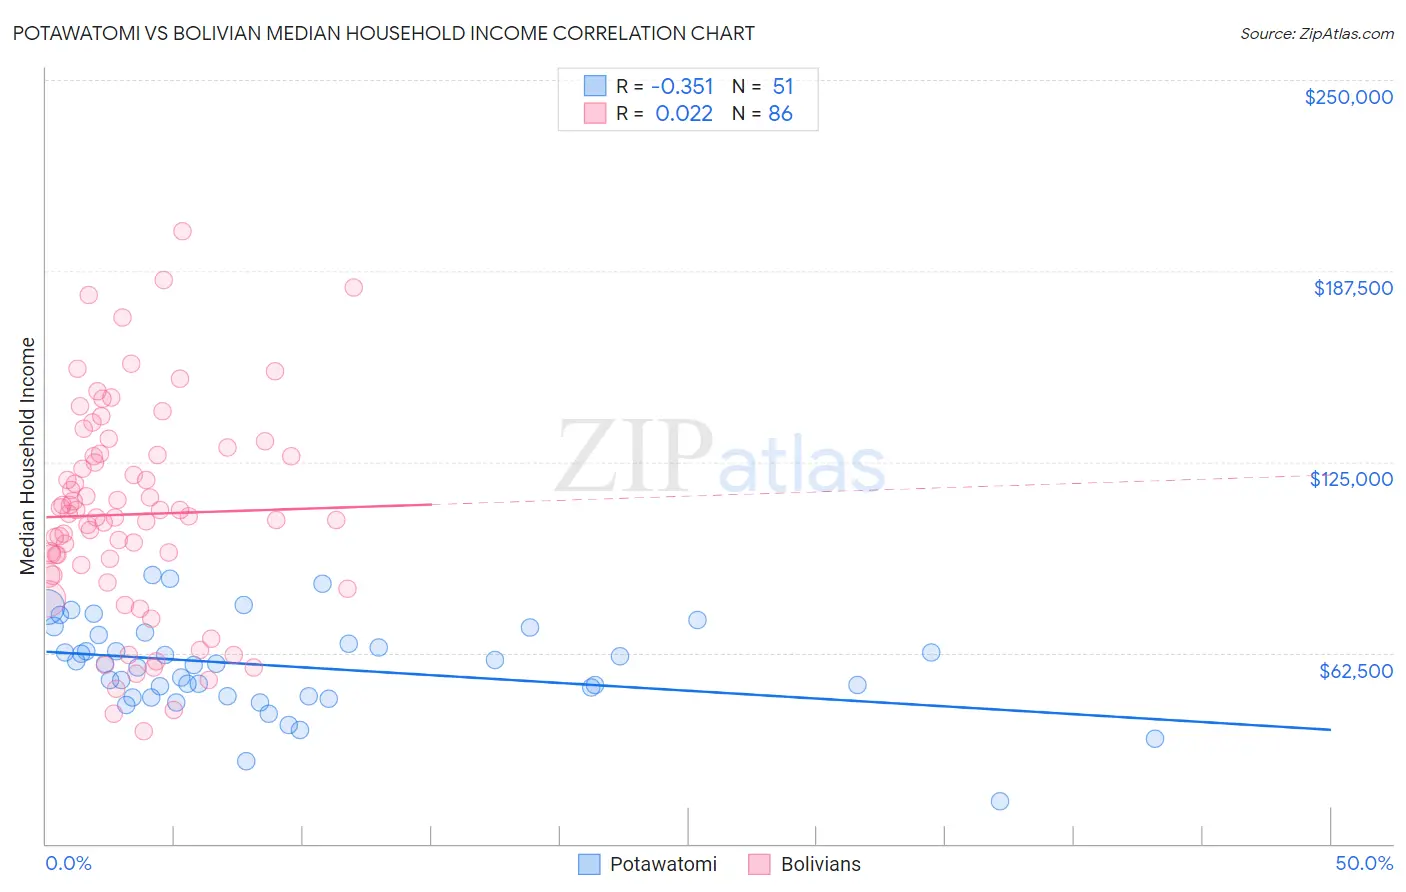
Potawatomi vs Bolivian Median Household Income Correlation Chart

The statistical analysis conducted on geographies consisting of 117,750,018 people shows a mild negative correlation between the proportion of Potawatomi and median household income in the United States with a correlation coefficient (R) of -0.351 and weighted average of $72,576. Similarly, the statistical analysis conducted on geographies consisting of 184,606,856 people shows no correlation between the proportion of Bolivians and median household income in the United States with a correlation coefficient (R) of 0.022 and weighted average of $102,195, a difference of 40.8%.
Potawatomi vs Bolivian Median Household Income

Median Household Income Correlation Summary

MeasurementPotawatomiBolivian
Minimum$13,750$36,777
Maximum$87,880$200,625
Range$74,130$163,848
Mean$58,038$107,810
Median$58,924$106,861
Interquartile 25% (IQ1)$48,403$87,882
Interquartile 75% (IQ3)$68,477$127,141
Interquartile Range (IQR)$20,074$39,259
Standard Deviation (Sample)$14,790$34,248
Standard Deviation (Population)$14,645$34,049

Similar Demographics by Median Household Income

Demographics Similar to Potawatomi by Median Household Income

In terms of median household income, the demographic groups most similar to Potawatomi are Honduran ($72,588, a difference of 0.020%), Immigrants from Haiti ($72,599, a difference of 0.030%), African ($72,650, a difference of 0.10%), Shoshone ($72,660, a difference of 0.12%), and Cherokee ($72,682, a difference of 0.15%).
DemographicsRating | RankMedian Household Income
Indonesians
0.0
/100
|
#299
Tragic
$72,856
Immigrants | Dominica
0.0
/100
|
#300
Tragic
$72,760
Cherokee
0.0
/100
|
#301
Tragic
$72,682
Shoshone
0.0
/100
|
#302
Tragic
$72,660
Africans
0.0
/100
|
#303
Tragic
$72,650
Immigrants | Haiti
0.0
/100
|
#304
Tragic
$72,599
Hondurans
0.0
/100
|
#305
Tragic
$72,588
Potawatomi
0.0
/100
|
#306
Tragic
$72,576
Ute
0.0
/100
|
#307
Tragic
$72,402
Yakama
0.0
/100
|
#308
Tragic
$72,225
Immigrants | Caribbean
0.0
/100
|
#309
Tragic
$71,860
U.S. Virgin Islanders
0.0
/100
|
#310
Tragic
$71,853
Immigrants | Zaire
0.0
/100
|
#311
Tragic
$71,801
Immigrants | Honduras
0.0
/100
|
#312
Tragic
$71,452
Immigrants | Bahamas
0.0
/100
|
#313
Tragic
$71,349

Demographics Similar to Bolivians by Median Household Income

In terms of median household income, the demographic groups most similar to Bolivians are Immigrants from Australia ($102,562, a difference of 0.36%), Eastern European ($101,781, a difference of 0.41%), Asian ($101,681, a difference of 0.50%), Cypriot ($102,843, a difference of 0.63%), and Immigrants from Korea ($102,962, a difference of 0.75%).
DemographicsRating | RankMedian Household Income
Immigrants | Eastern Asia
100.0
/100
|
#13
Exceptional
$104,796
Immigrants | Ireland
100.0
/100
|
#14
Exceptional
$104,692
Immigrants | Israel
100.0
/100
|
#15
Exceptional
$104,090
Burmese
100.0
/100
|
#16
Exceptional
$103,145
Immigrants | Korea
100.0
/100
|
#17
Exceptional
$102,962
Cypriots
100.0
/100
|
#18
Exceptional
$102,843
Immigrants | Australia
100.0
/100
|
#19
Exceptional
$102,562
Bolivians
100.0
/100
|
#20
Exceptional
$102,195
Eastern Europeans
100.0
/100
|
#21
Exceptional
$101,781
Asians
100.0
/100
|
#22
Exceptional
$101,681
Immigrants | Bolivia
100.0
/100
|
#23
Exceptional
$101,394
Immigrants | Japan
100.0
/100
|
#24
Exceptional
$100,711
Immigrants | Sweden
100.0
/100
|
#25
Exceptional
$100,699
Immigrants | Belgium
100.0
/100
|
#26
Exceptional
$100,306
Bhutanese
100.0
/100
|
#27
Exceptional
$100,151