Pima vs Nonimmigrants Median Family Income
COMPARE
Pima
Nonimmigrants
Median Family Income
Median Family Income Comparison
Pima
Nonimmigrants
$77,431
MEDIAN FAMILY INCOME
0.0/ 100
METRIC RATING
339th/ 347
METRIC RANK
$96,231
MEDIAN FAMILY INCOME
3.6/ 100
METRIC RATING
224th/ 347
METRIC RANK
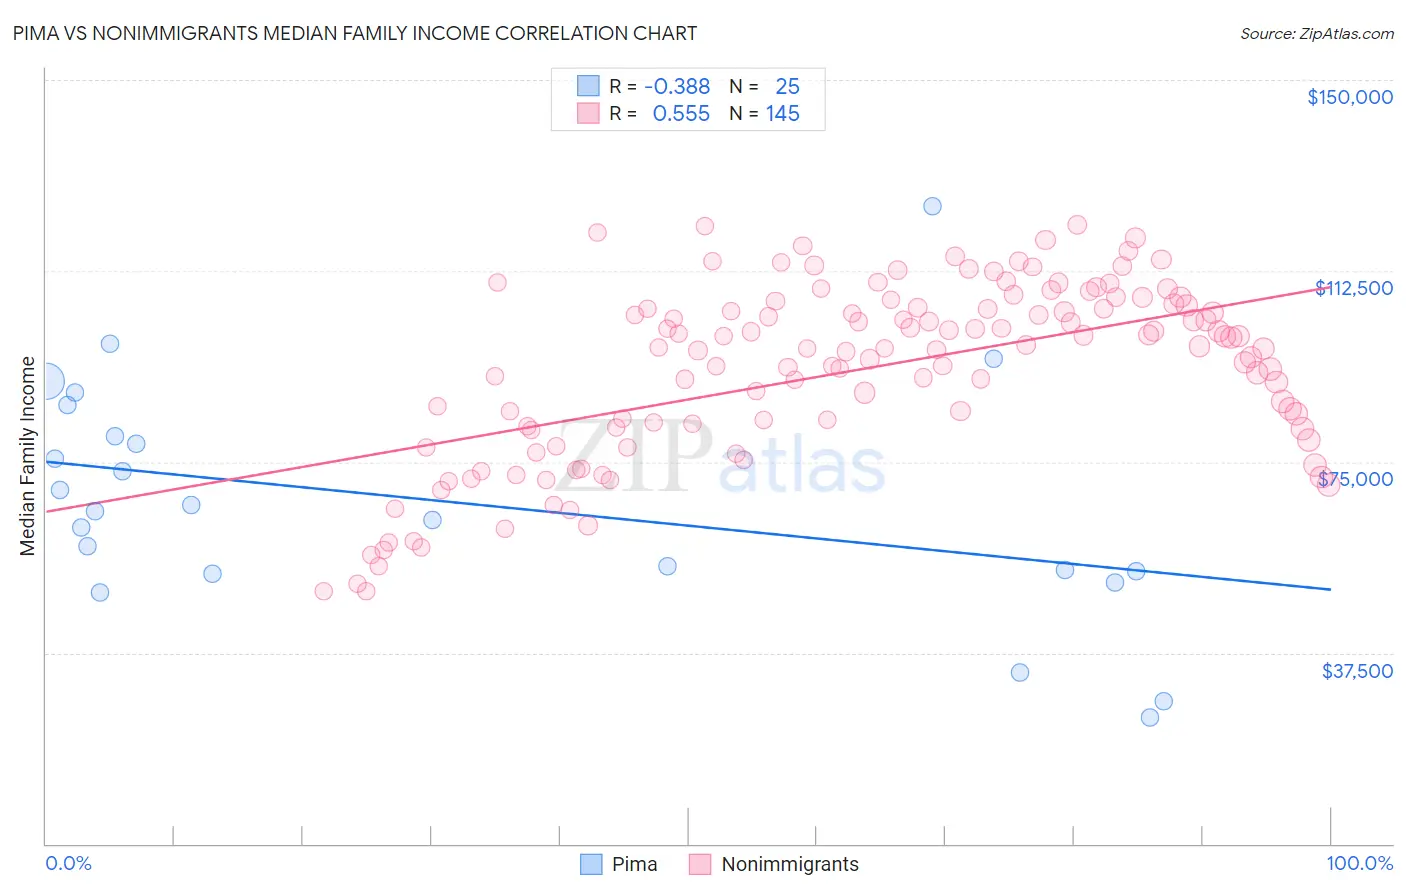
Pima vs Nonimmigrants Median Family Income Correlation Chart
The statistical analysis conducted on geographies consisting of 61,529,758 people shows a mild negative correlation between the proportion of Pima and median family income in the United States with a correlation coefficient (R) of -0.388 and weighted average of $77,431. Similarly, the statistical analysis conducted on geographies consisting of 582,429,666 people shows a substantial positive correlation between the proportion of Nonimmigrants and median family income in the United States with a correlation coefficient (R) of 0.555 and weighted average of $96,231, a difference of 24.3%.
Median Family Income Correlation Summary
| Measurement | Pima | Nonimmigrants |
| Minimum | $24,821 | $49,547 |
| Maximum | $125,278 | $121,513 |
| Range | $100,457 | $71,966 |
| Mean | $67,157 | $93,127 |
| Median | $65,417 | $97,277 |
| Interquartile 25% (IQ1) | $53,298 | $81,657 |
| Interquartile 75% (IQ3) | $83,045 | $105,547 |
| Interquartile Range (IQR) | $29,747 | $23,890 |
| Standard Deviation (Sample) | $23,070 | $17,276 |
| Standard Deviation (Population) | $22,604 | $17,216 |
Similar Demographics by Median Family Income
Demographics Similar to Pima by Median Family Income
In terms of median family income, the demographic groups most similar to Pima are Immigrants from Yemen ($77,457, a difference of 0.030%), Hopi ($77,188, a difference of 0.32%), Pueblo ($76,880, a difference of 0.72%), Yuman ($78,055, a difference of 0.80%), and Immigrants from Cuba ($78,249, a difference of 1.1%).
| Demographics | Rating | Rank | Median Family Income |
| Natives/Alaskans | 0.0 /100 | #332 | Tragic $80,908 |
| Kiowa | 0.0 /100 | #333 | Tragic $80,885 |
| Menominee | 0.0 /100 | #334 | Tragic $79,563 |
| Yup'ik | 0.0 /100 | #335 | Tragic $79,290 |
| Immigrants | Cuba | 0.0 /100 | #336 | Tragic $78,249 |
| Yuman | 0.0 /100 | #337 | Tragic $78,055 |
| Immigrants | Yemen | 0.0 /100 | #338 | Tragic $77,457 |
| Pima | 0.0 /100 | #339 | Tragic $77,431 |
| Hopi | 0.0 /100 | #340 | Tragic $77,188 |
| Pueblo | 0.0 /100 | #341 | Tragic $76,880 |
| Crow | 0.0 /100 | #342 | Tragic $76,605 |
| Houma | 0.0 /100 | #343 | Tragic $76,188 |
| Tohono O'odham | 0.0 /100 | #344 | Tragic $72,193 |
| Navajo | 0.0 /100 | #345 | Tragic $70,989 |
| Puerto Ricans | 0.0 /100 | #346 | Tragic $70,423 |
Demographics Similar to Nonimmigrants by Median Family Income
In terms of median family income, the demographic groups most similar to Nonimmigrants are Venezuelan ($96,281, a difference of 0.050%), Vietnamese ($96,123, a difference of 0.11%), Immigrants from Nigeria ($96,439, a difference of 0.22%), Immigrants from Ghana ($96,544, a difference of 0.33%), and Sudanese ($96,783, a difference of 0.57%).
| Demographics | Rating | Rank | Median Family Income |
| Japanese | 6.0 /100 | #217 | Tragic $97,288 |
| Immigrants | Cambodia | 5.8 /100 | #218 | Tragic $97,222 |
| Delaware | 5.1 /100 | #219 | Tragic $96,958 |
| Sudanese | 4.7 /100 | #220 | Tragic $96,783 |
| Immigrants | Ghana | 4.2 /100 | #221 | Tragic $96,544 |
| Immigrants | Nigeria | 4.0 /100 | #222 | Tragic $96,439 |
| Venezuelans | 3.7 /100 | #223 | Tragic $96,281 |
| Immigrants | Nonimmigrants | 3.6 /100 | #224 | Tragic $96,231 |
| Vietnamese | 3.4 /100 | #225 | Tragic $96,123 |
| Immigrants | Panama | 2.7 /100 | #226 | Tragic $95,647 |
| Alaska Natives | 2.6 /100 | #227 | Tragic $95,573 |
| Immigrants | Azores | 2.4 /100 | #228 | Tragic $95,402 |
| Marshallese | 2.2 /100 | #229 | Tragic $95,293 |
| Malaysians | 2.2 /100 | #230 | Tragic $95,230 |
| Ecuadorians | 2.1 /100 | #231 | Tragic $95,114 |