Pennsylvania German vs Immigrants from Trinidad and Tobago Median Female Earnings
COMPARE
Pennsylvania German
Immigrants from Trinidad and Tobago
Median Female Earnings
Median Female Earnings Comparison
Pennsylvania Germans
Immigrants from Trinidad and Tobago
$34,802
MEDIAN FEMALE EARNINGS
0.0/ 100
METRIC RATING
315th/ 347
METRIC RANK
$40,895
MEDIAN FEMALE EARNINGS
92.3/ 100
METRIC RATING
126th/ 347
METRIC RANK
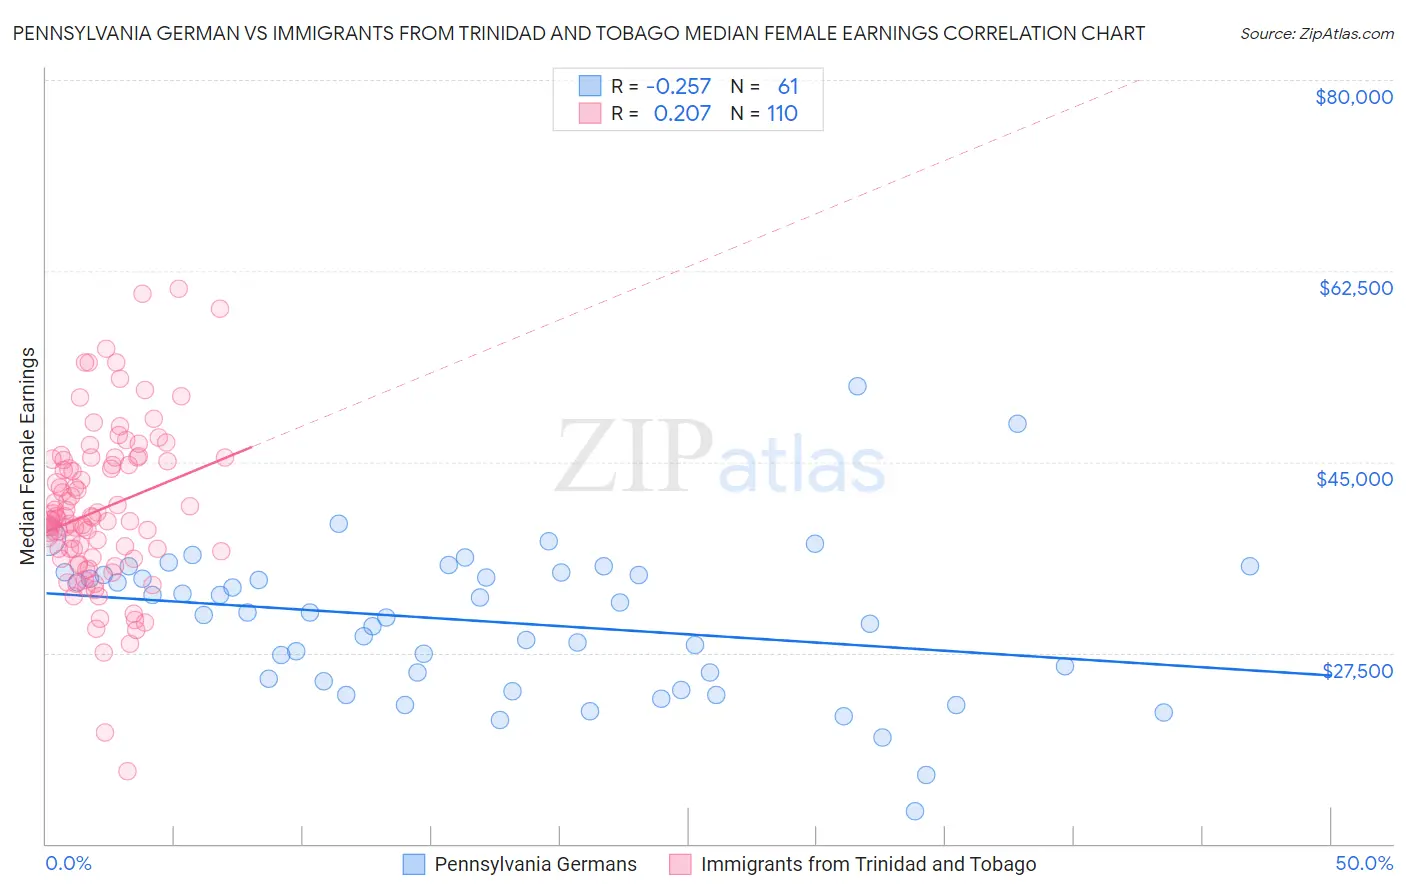
Pennsylvania German vs Immigrants from Trinidad and Tobago Median Female Earnings Correlation Chart
The statistical analysis conducted on geographies consisting of 233,955,345 people shows a weak negative correlation between the proportion of Pennsylvania Germans and median female earnings in the United States with a correlation coefficient (R) of -0.257 and weighted average of $34,802. Similarly, the statistical analysis conducted on geographies consisting of 223,490,788 people shows a weak positive correlation between the proportion of Immigrants from Trinidad and Tobago and median female earnings in the United States with a correlation coefficient (R) of 0.207 and weighted average of $40,895, a difference of 17.5%.
Median Female Earnings Correlation Summary
| Measurement | Pennsylvania German | Immigrants from Trinidad and Tobago |
| Minimum | $12,961 | $16,600 |
| Maximum | $51,875 | $60,818 |
| Range | $38,914 | $44,218 |
| Mean | $30,372 | $40,591 |
| Median | $31,194 | $39,706 |
| Interquartile 25% (IQ1) | $25,044 | $36,241 |
| Interquartile 75% (IQ3) | $34,733 | $45,207 |
| Interquartile Range (IQR) | $9,690 | $8,965 |
| Standard Deviation (Sample) | $6,887 | $7,375 |
| Standard Deviation (Population) | $6,830 | $7,342 |
Similar Demographics by Median Female Earnings
Demographics Similar to Pennsylvania Germans by Median Female Earnings
In terms of median female earnings, the demographic groups most similar to Pennsylvania Germans are Cherokee ($34,742, a difference of 0.17%), Potawatomi ($34,739, a difference of 0.18%), Apache ($34,895, a difference of 0.27%), Immigrants from Yemen ($34,693, a difference of 0.31%), and Shoshone ($34,677, a difference of 0.36%).
| Demographics | Rating | Rank | Median Female Earnings |
| Immigrants | Bahamas | 0.0 /100 | #308 | Tragic $35,027 |
| Hondurans | 0.0 /100 | #309 | Tragic $35,013 |
| Chippewa | 0.0 /100 | #310 | Tragic $35,003 |
| Ute | 0.0 /100 | #311 | Tragic $34,960 |
| Yaqui | 0.0 /100 | #312 | Tragic $34,943 |
| Cubans | 0.0 /100 | #313 | Tragic $34,942 |
| Apache | 0.0 /100 | #314 | Tragic $34,895 |
| Pennsylvania Germans | 0.0 /100 | #315 | Tragic $34,802 |
| Cherokee | 0.0 /100 | #316 | Tragic $34,742 |
| Potawatomi | 0.0 /100 | #317 | Tragic $34,739 |
| Immigrants | Yemen | 0.0 /100 | #318 | Tragic $34,693 |
| Shoshone | 0.0 /100 | #319 | Tragic $34,677 |
| Immigrants | Honduras | 0.0 /100 | #320 | Tragic $34,647 |
| Hispanics or Latinos | 0.0 /100 | #321 | Tragic $34,421 |
| Chickasaw | 0.0 /100 | #322 | Tragic $34,414 |
Demographics Similar to Immigrants from Trinidad and Tobago by Median Female Earnings
In terms of median female earnings, the demographic groups most similar to Immigrants from Trinidad and Tobago are Ugandan ($40,889, a difference of 0.020%), Austrian ($40,923, a difference of 0.070%), Trinidadian and Tobagonian ($40,958, a difference of 0.15%), Carpatho Rusyn ($40,825, a difference of 0.17%), and Guyanese ($40,973, a difference of 0.19%).
| Demographics | Rating | Rank | Median Female Earnings |
| Immigrants | Philippines | 95.0 /100 | #119 | Exceptional $41,114 |
| Immigrants | Kuwait | 94.4 /100 | #120 | Exceptional $41,055 |
| Croatians | 93.7 /100 | #121 | Exceptional $40,993 |
| Immigrants | Jordan | 93.5 /100 | #122 | Exceptional $40,977 |
| Guyanese | 93.4 /100 | #123 | Exceptional $40,973 |
| Trinidadians and Tobagonians | 93.2 /100 | #124 | Exceptional $40,958 |
| Austrians | 92.7 /100 | #125 | Exceptional $40,923 |
| Immigrants | Trinidad and Tobago | 92.3 /100 | #126 | Exceptional $40,895 |
| Ugandans | 92.2 /100 | #127 | Exceptional $40,889 |
| Carpatho Rusyns | 91.2 /100 | #128 | Exceptional $40,825 |
| Zimbabweans | 90.8 /100 | #129 | Exceptional $40,798 |
| Immigrants | Guyana | 90.3 /100 | #130 | Exceptional $40,773 |
| Chileans | 90.0 /100 | #131 | Exceptional $40,757 |
| Immigrants | Uganda | 89.7 /100 | #132 | Excellent $40,739 |
| Syrians | 89.5 /100 | #133 | Excellent $40,727 |